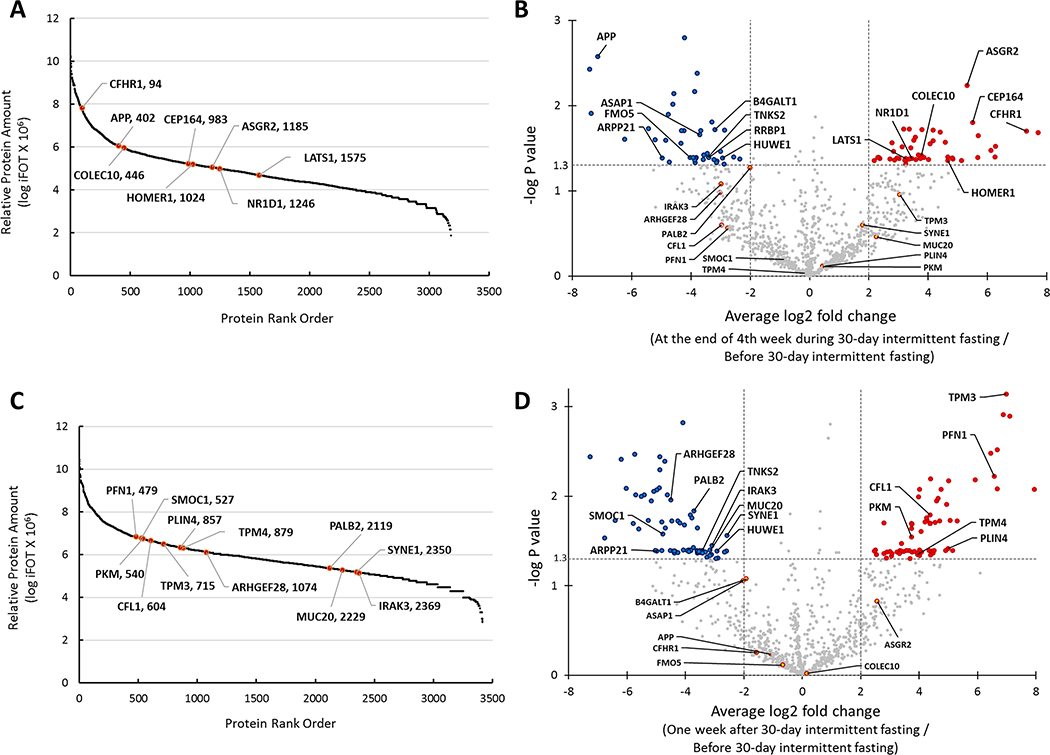
Figure 2.
A. Distribution of normalized relative gene protein product (GP) amount and location of significantly changed selected proteins in serum samples taken at the end of 4th week during 30-day intermittent fasting shown in GP name and rank order. B. Volcano plot shows GPs that had an equal to or greater than 4-fold significant change (blue and red colors represent a significant decrease and increase in the levels of GPs, respectively) at the end of 4th week during 30-day intermittent fasting compared with the levels before 30-day intermittent fasting. C. Distribution of normalized relative GP amount and location of significantly changed selected proteins in serum samples taken one week after 30-day intermittent fasting shown in GP name and rank order. D. Volcano plot shows GPs that had an equal to or greater than 4-fold significant change (blue and red colors represent a significant decrease and increase in the levels of GPs, respectively) one week after 30-day intermittent fasting compared with the levels before 30-day intermittent fasting.

