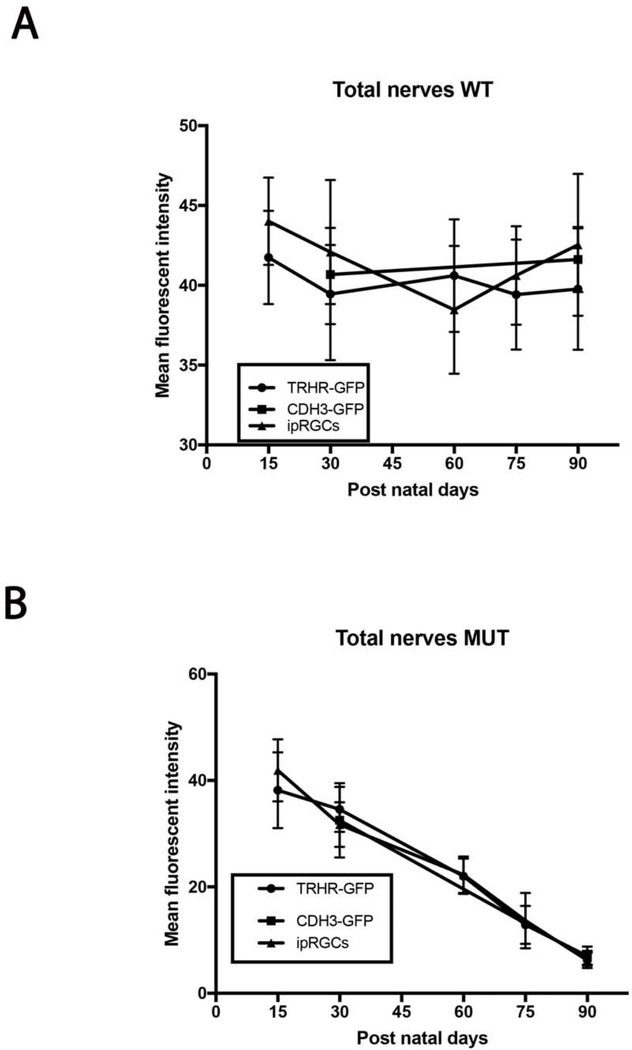
Figure 10.
Comparison of total axonal degeneration in MUT and WT mice between strains. (A) Mean fluorescent intensity between each strain within each time point show no significant differences in WT animals. The values are represented as mean ± SD (n=4–6). Two Way-ANOVA then Sidak’s post hoc test for time points 15, 60 and 75. Two Way-ANOVA then Tukey’s post hoc test for time points 30 and 90. (B) Mean fluorescent intensity between each strain within each time point show no significant differences in MUT animals. The values are represented as mean ±SD (n=4–6). Two Way-ANOVA then Sidak’s post hoc test for time points 15, 60 and 75. Two Way-ANOVA then Tukey’s post hoc test for time points 30 and 90.

