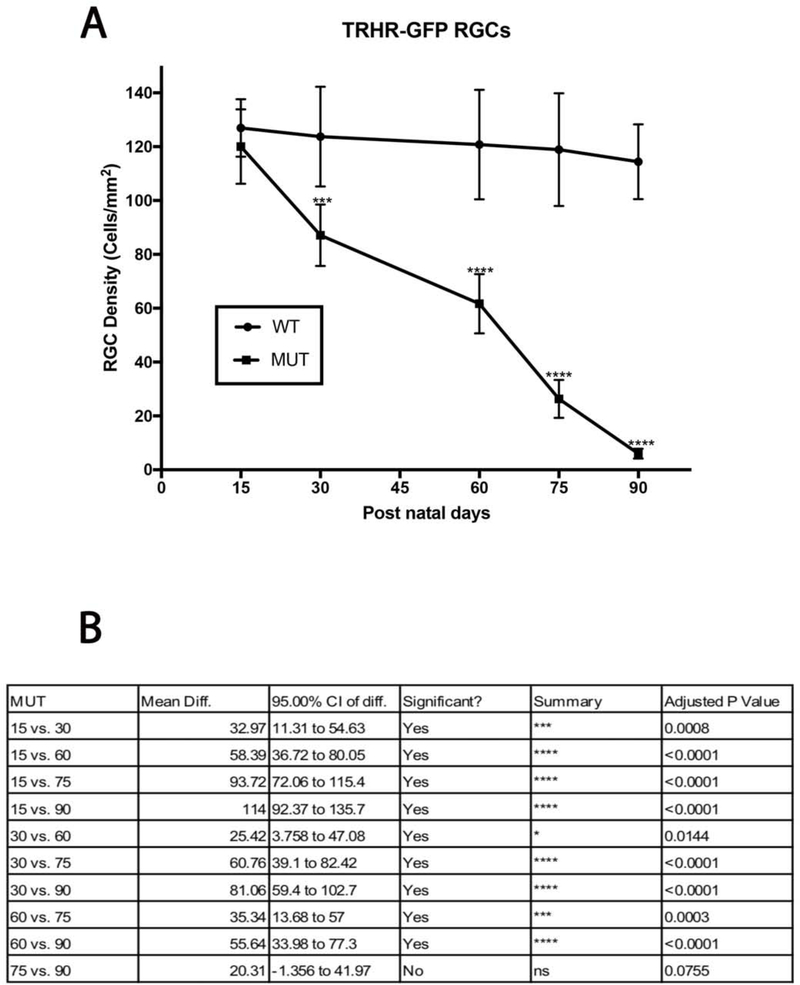
Figure 5:
TRHR-RGC loss in MUT and WT mice: (A) There was significant decline in TRHR-RGC density in MUT animals at post-natal days 30, 60, 75 and 90. The values are represented as mean ±SD (n=6). ***: p=0.0002, ****: p<0.0001 by Two Way-ANOVA then Sidak’s post hoc test. (B) TRHR-RGC density between each time point show varying degrees of differences in MUT animals. The values are represented as mean ±SD (n=6). Two Way-ANOVA then Tukey’s post hoc test.

