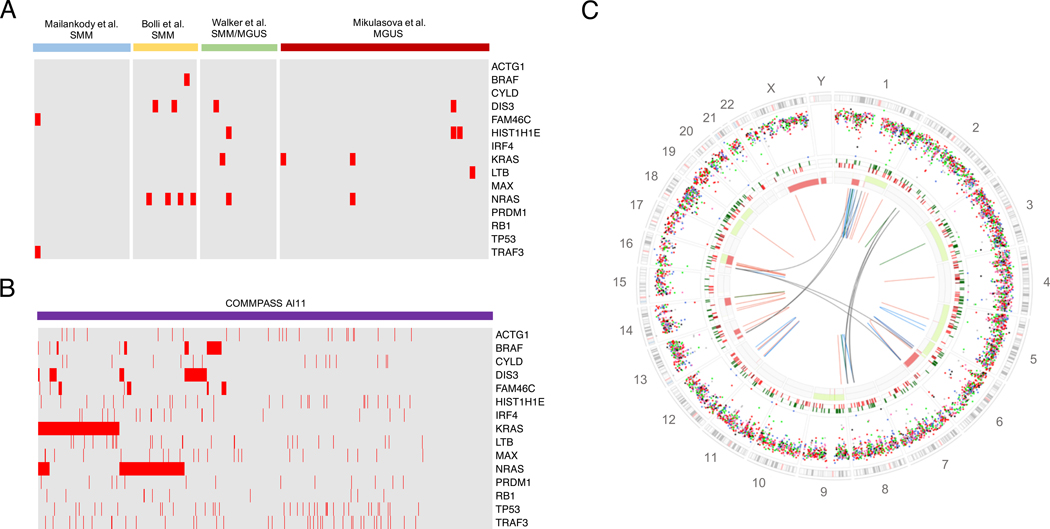
Figure 3.
MM precursors genomic landscape. A-B) Heatmap showing the prevalence of recurrent MM mutations among MGUS/SMM/MMS according to the 4 main next generation sequencing studies and among newly diagnosed MM enrolled within the COMMPASS trial.31,44–46 The CoMMpass data were generated as part of the Multiple Myeloma Research Foundation Personalized Medicine Initiatives (https://research.themmrf.org and www.themmrf.org). C) Example of SMM whole genome landscape. All main genomic events are reported in this genome plot: mutations (external circle), indels (middle circle; dark green and brown lines represent insertion and deletion respectively), copy number variants (red = deletions, green = gain) and rearrangements (blue = inversion, red = deletions, green = ITD, black = translocation). This patients was a non-high risk SMM10 and progressed after 42 months.

