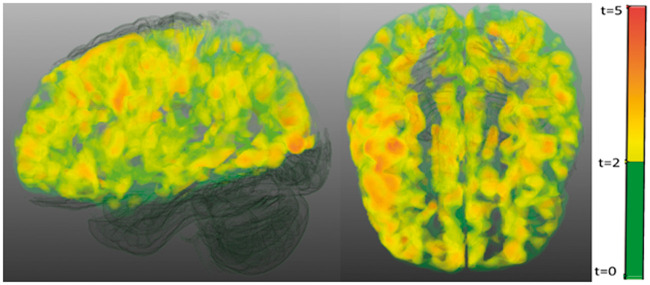
Figure 4.
Voxel based analysis of the differences in cerebral blood flow between the group of patients with cortical microinfarct compared to the group of patients without cortical microinfarcts. Significant clusters (cluster threshold of p<.001, family wise corrected to <0.05) are shown in yellow to red, non-significant clusters are shown in green.

