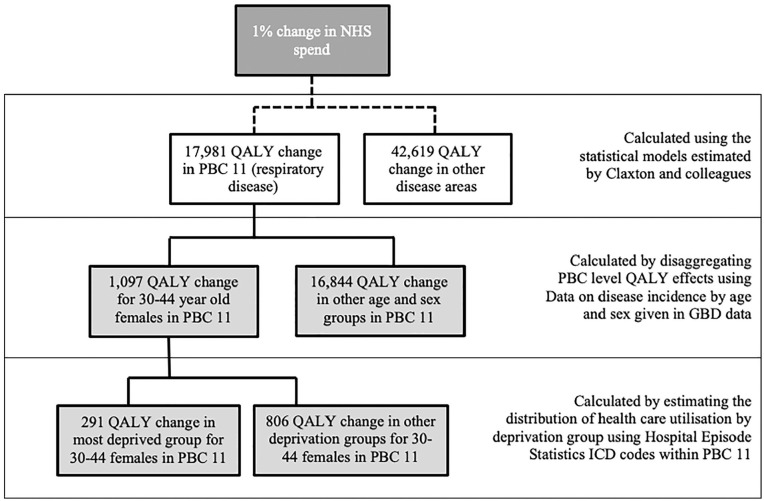
Figure 1.
Influence diagram demonstrating how the health effects of a 1% change in health care expenditure for a single disease area are distributed by age, sex, and socioeconomic status. GBD, Global Burden of Disease; ICD, International Classification of Diseases; NHS, National Health Service; PBC, program budgeting category; QALY, quality-adjusted life-year.

