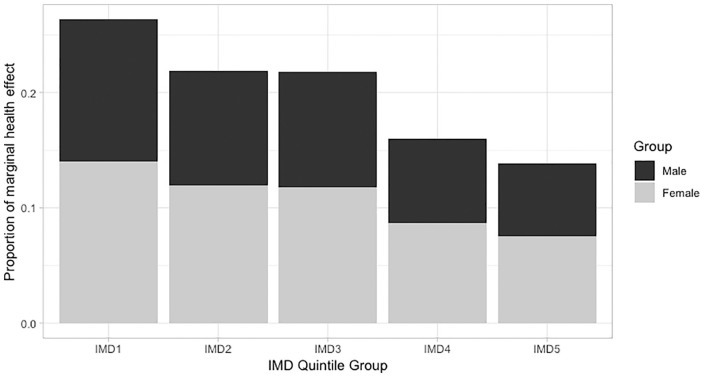
Figure 2.
Socioeconomic distribution of health effects from health care expenditure changes for the English population. IMD, Index of Multiple Deprivation (1 = most deprived group, 5 = least deprived). differences in quality-adjusted life-year effects between sexes should be treated with caution. This is because the larger effects for women reflect their levels of health care utilization rather than any systematic differences in the health care services being affected by expenditure changes.

