FIGURE 1.
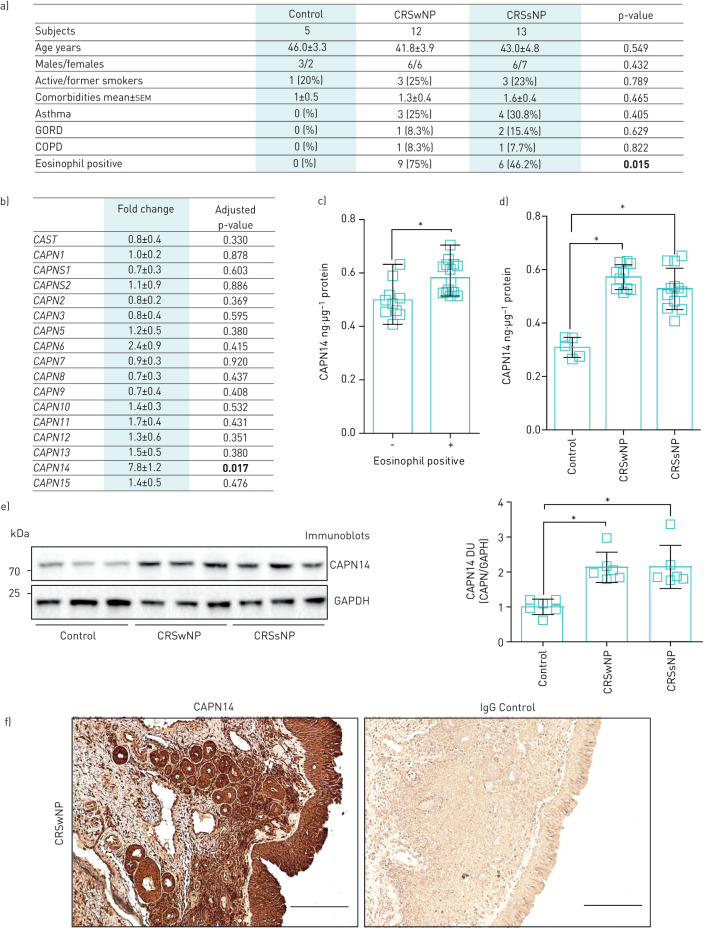
Demographics, gene expression and protein levels of calpain (CAPN) 14 from controls and chronic rhinosinusitis (CRS) patients. a) Patient demographics. b) Fold changes in gene expression of all human CAPN and CAST genes in nasal tissue of CRS with nasal polyps (wNP) compared to non-CRS controls (n=5 per group). CAPN14 protein concentration from nasal tissue determined by ELISA from c) eosinophil-positive and -negative CRS subjects and d) control, CRSwNP and CRS without nasal polyps (sNP) subjects. Data are presented as nanogram of CAPN14 per microgram of total nasal tissue protein. e) Immunoblots and densitometry analysis of CAPN14 and glyceraldehyde phosphate dehydrogenase (GAPDH) from non-CRS controls, CRSwNP and CRSsNP nasal tissues. Data are represented as densitometry units (DU) of CAPN14 relative to GAPDH. a–e) Data are presented as n (%), median (range) (boxes and whiskers in c), mean±sd or mean±sem. Data were analysed by D'Agostino and Pearson omnibus normality test, t-tests, Mann–Whitney or by one-way ANOVA and a Dunn's multiple comparisons test. p-values from quantitative PCR data were adjusted with the Benjamini–Hochberg procedure to correct for multiple comparisons. p-values are shown here and significant differences in bold or highlighted by *. f) Immunohistochemistry was performed on CRSwNP tissue with anti-CAPN14 or control IgG. Scale bars=200 μm. GORD: gastro-oesophageal reflux disease.

