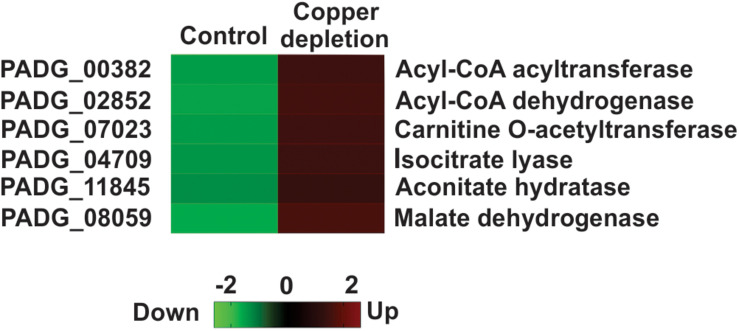
FIGURE 3.
Metabolic pathways regulated in P. brasiliensis in response to in vitro copper deprivation. Heat map showing increased quantity of proteins from beta oxidation, TCA and glyoxylate cycle in copper deprived P. brasiliensis yeast cells. Colors on the heat map indicate differential accumulation; red increased and green decreased. The heat map was constructed by GraphPad Prism software. Copper deprivation (50 μM BCS) and control (10 μM of CuSO4).

