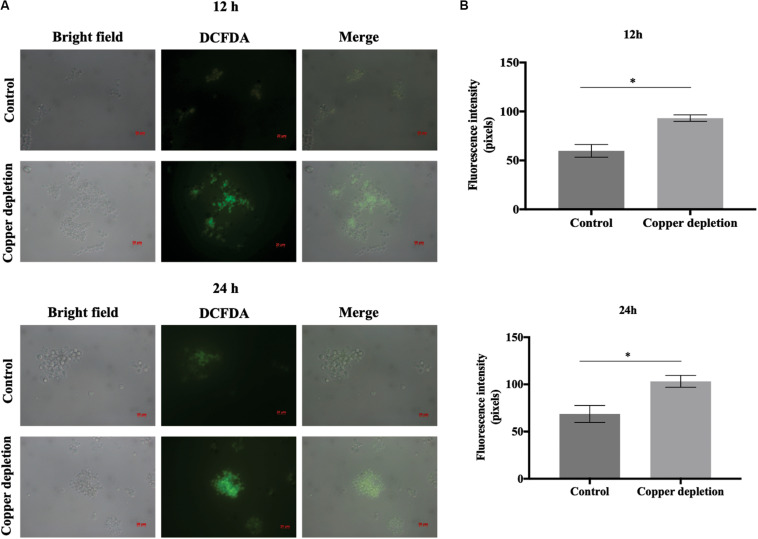
FIGURE 5.
Copper deprivation results in an increase of reactive oxygen species (ROS) (A) Detection of ROS during 12 and 24 h of copper deprivation Yeast cells were grown with and without copper, labeled with dichlorofluorescein 2′, 7′-diacetate (DCFDA) and analyzed by fluorescence microscopy. 50 μM BCS indicated copper depletion; control: 10 μM CuSO4. Bars indicate the standard deviation (B) Fluorescence intensity graphs. The minimum quantity of 50 cells per triplicate were used to construct the graphs. All representative images were magnified 400x. The data for the fluorescence intensity evaluation were obtained through the AxioVision Software (Carl Zeiss). *This demonstrates a significant difference between the samples with the p-value of ≤ 0.05. The error bars represent the standard deviation of the samples in triplicates. Control (10 μM of CuSO4) and copper deprivation (50 μM BCS).

