FIGURE 6.
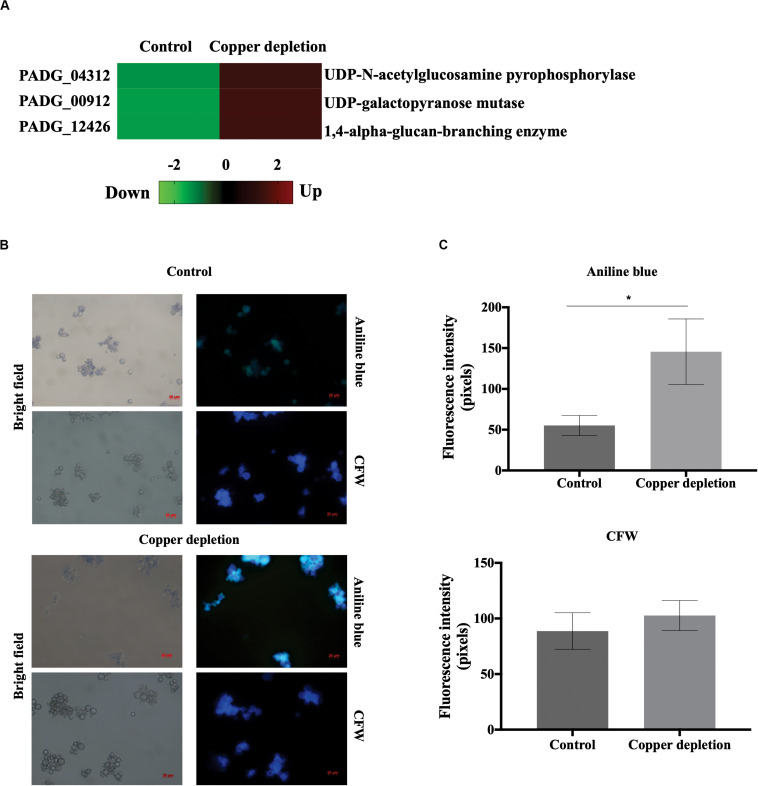
Evaluation of the cell wall metabolism in the yeast cells of P. brasiliensis in copper deprivation. (A) Heat map showing increased accumulation of proteins related to the cell wall metabolism during copper deprivation, with increased (red color) and decreased (green color) proteins. (B) Yeast cells were incubated in medium containing 10 μM of CuSO4 (control) or 50 μM BCS (copper depletion) during 24 h. For analysis of the amount of glucan and chitin the yeast cells were stained with aniline blue and Calcofluor White (CFW) respectively and analyzed by fluorescence microscopy. Bars represent the standard deviation. (C) Fluorescence intensity in control and copper-deprived yeast cells, both labeled with aniline blue and CFW. To determine significant differences in each condition, pixels intensity values were obtained from triplicates from at least 50 cells, each *indicated with p-value of ≤ 0.05. All representative images were magnified 400x, control (10 μM of CuSO4) and copper deprivation (50 μM BCS).

