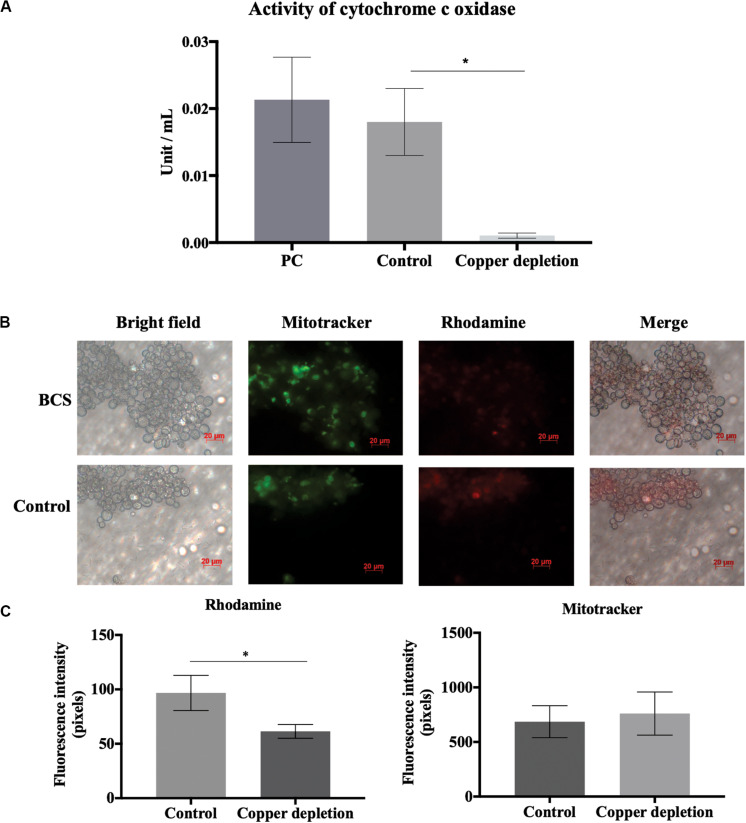
FIGURE 7.
Activity of cytochrome c oxidase (Coxp) and oxidative phosphorylation are regulated by copper deprivation. (A) Yeast cells of P. brasiliensis were incubated in the presence and absence of copper, and the enzymatic activity of Coxp was evaluated. PC represents the positive control of the Assay Kit (Sigma-Aldrich – CYTOCOX1). Bars represent the standard deviation. (B) Yeast cells of P. brasiliensis were labeled with mitotracker and rhodamine for verification of integrity and mitochondrial activity, respectively, by fluorescence microscopy. (C) Fluorescence intensity graph of yeast cells labeled with mitotracker and rhodamine. The data for fluorescence intensity evaluation were obtained through the AxioVision Software (Carl Zeiss). The values of fluorescence intensity (in pixels) and the standard error of each analysis were used to plot the graph. Data are expressed as mean ± standard error (represented using error bars), (∗) representing p ≤ 0.05. All representative images were magnified 400x, copper deprivation (50 μM BCS) and control (10 μM of CuSO4).

