FIGURE 8.
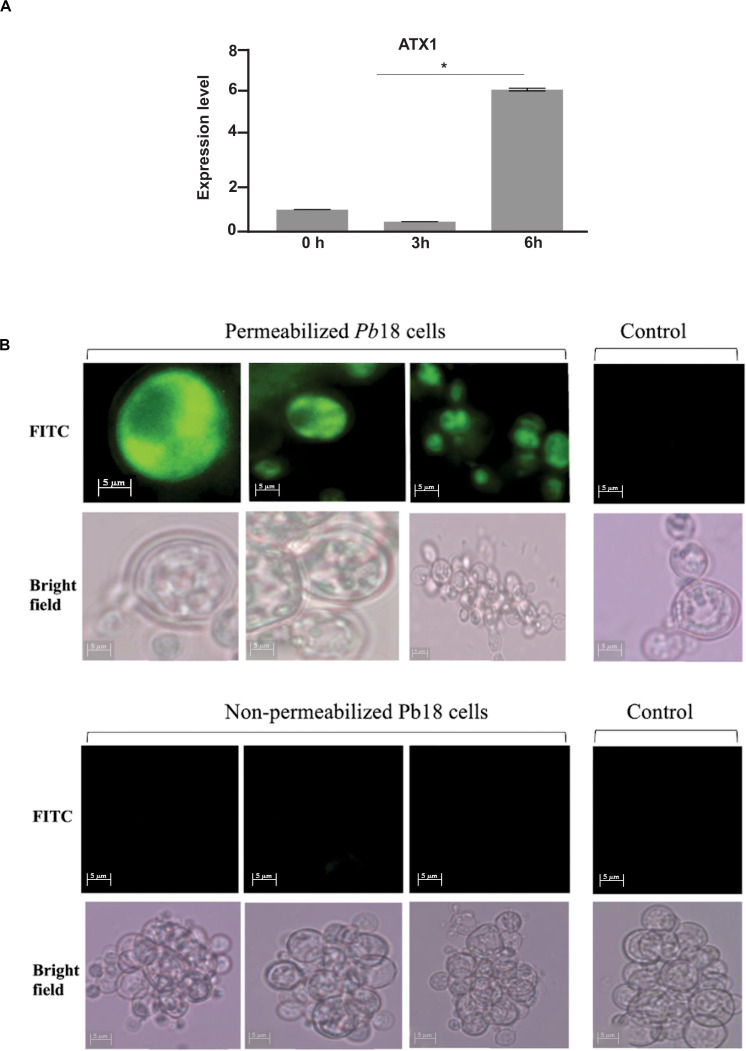
Expression of the transcript and cell localization of Atx1p in P. brasiliensis. (A) Expression analysis of Atx1 in yeast cells during copper deprivation. Relative levels of expression of the Atx1 gene in treatment with 50 mM BCS at different time points. Gene expression values were normalized using the expression values of the transcript coding for L34 (GenBank accession number (PADG_04085). *Statistically significant (p < 0.05). (B) Atx1p immunofluorescence. The immunofluorescence assay was performed with triton X-100 permeabilized and non-permeabilized cells, incubated with anti-Atx1p polyclonal antibodies for 1 h, followed by incubation with the isothiocyanate-labeled mouse anti-IgG secondary antibody fluorescein – FITC for 1 h. Fluorescence was only observed in permeabilized cells. Images were taken in bright field and at 450–490 nm wavelength for viewing FITC fluorophore at 1000x magnification using the Axio Scope A1 fluorescence microscope. Digital images were acquired using AxionVision.

