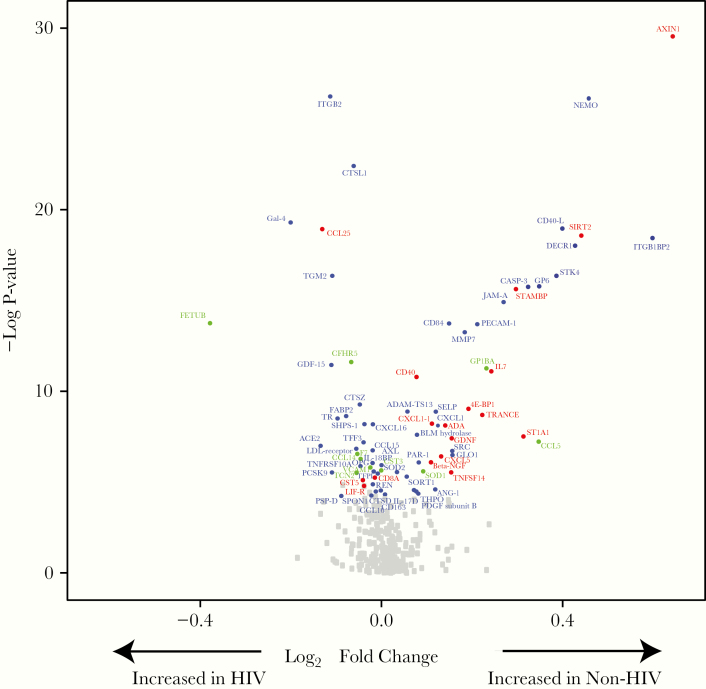
Figure 2.
Differential expression of proteins between participants with and without human immunodeficiency virus (HIV) at baseline. A volcano plot demonstrates differential protein expression in HIV-infected vs non-HIV-infected participants. Fold change refers to the difference in the mean Normalized Protein eXpression ([NPX] log2) units between the HIV (N = 89 participants) and non-HIV (N = 46 participants) groups. Proteins with significantly different expression at baseline between HIV and non-HIV groups are shown in color and named. A false discovery rate P < .05 was considered statistically significant. Proteins are colored based on their respective panel using the following classifications: cardiometabolic panel proteins in green, cardiovascular panels II and III proteins in blue, and inflammation panel proteins in red. Gray squares represent other proteins assessed through proximity extension assay (PEA) technology, which was not significantly different at baseline between participants in the HIV and non-HIV groups. A total of 368 proteins were assessed. A limited number of proteins (n = 10) were included in more than 1 panel. All data are presented and analyzed. Substantive differences between measurements of duplicated proteins were generally not seen at baseline, and no duplicated proteins were significant in the longitudinal analyses. See Supplemental Methods for abbreviations.

