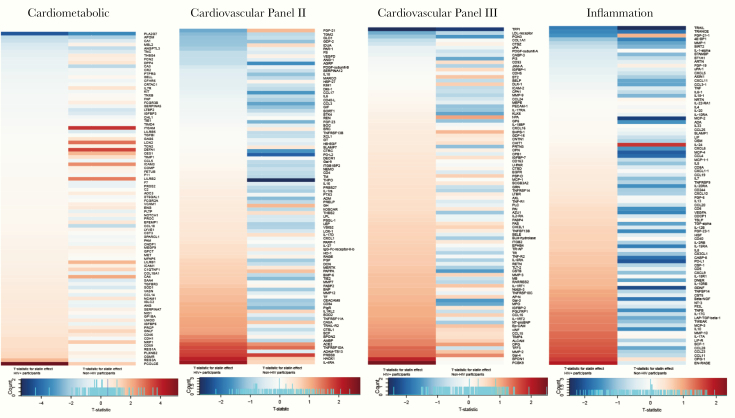
Figure 5.
Differential expression of proteins after pitavastatin therapy among participants with and without human immunodeficiency virus (HIV). Heat maps are shown for each protein biomarker panel (from left to right: Cardiometabolic, Cardiovascular II, Cardiovascular III, and Inflammation). Within each heat map, the t-statistic for statin treatment effect is demonstrated on the left for participants with HIV (N = 89) and on the right for participants without HIV (N = 23). The protein order of each heat map was determined by order of the t-statistic for the participants with HIV from most negative to most positive for each panel. Blue indicates a decrease in the protein level after pitavastatin therapy, and the red indicates an increase in the protein level after pitavastatin therapy. Among the participants with HIV, 2 proteins changed significantly with pitavastatin therapy, PCOLCE and PLA2G7. Among participants without HIV, 3 proteins changed significantly with pitavastatin therapy PLA2G7, ITGAM, and DEFA1. See Supplemental Methods for abbreviations.

