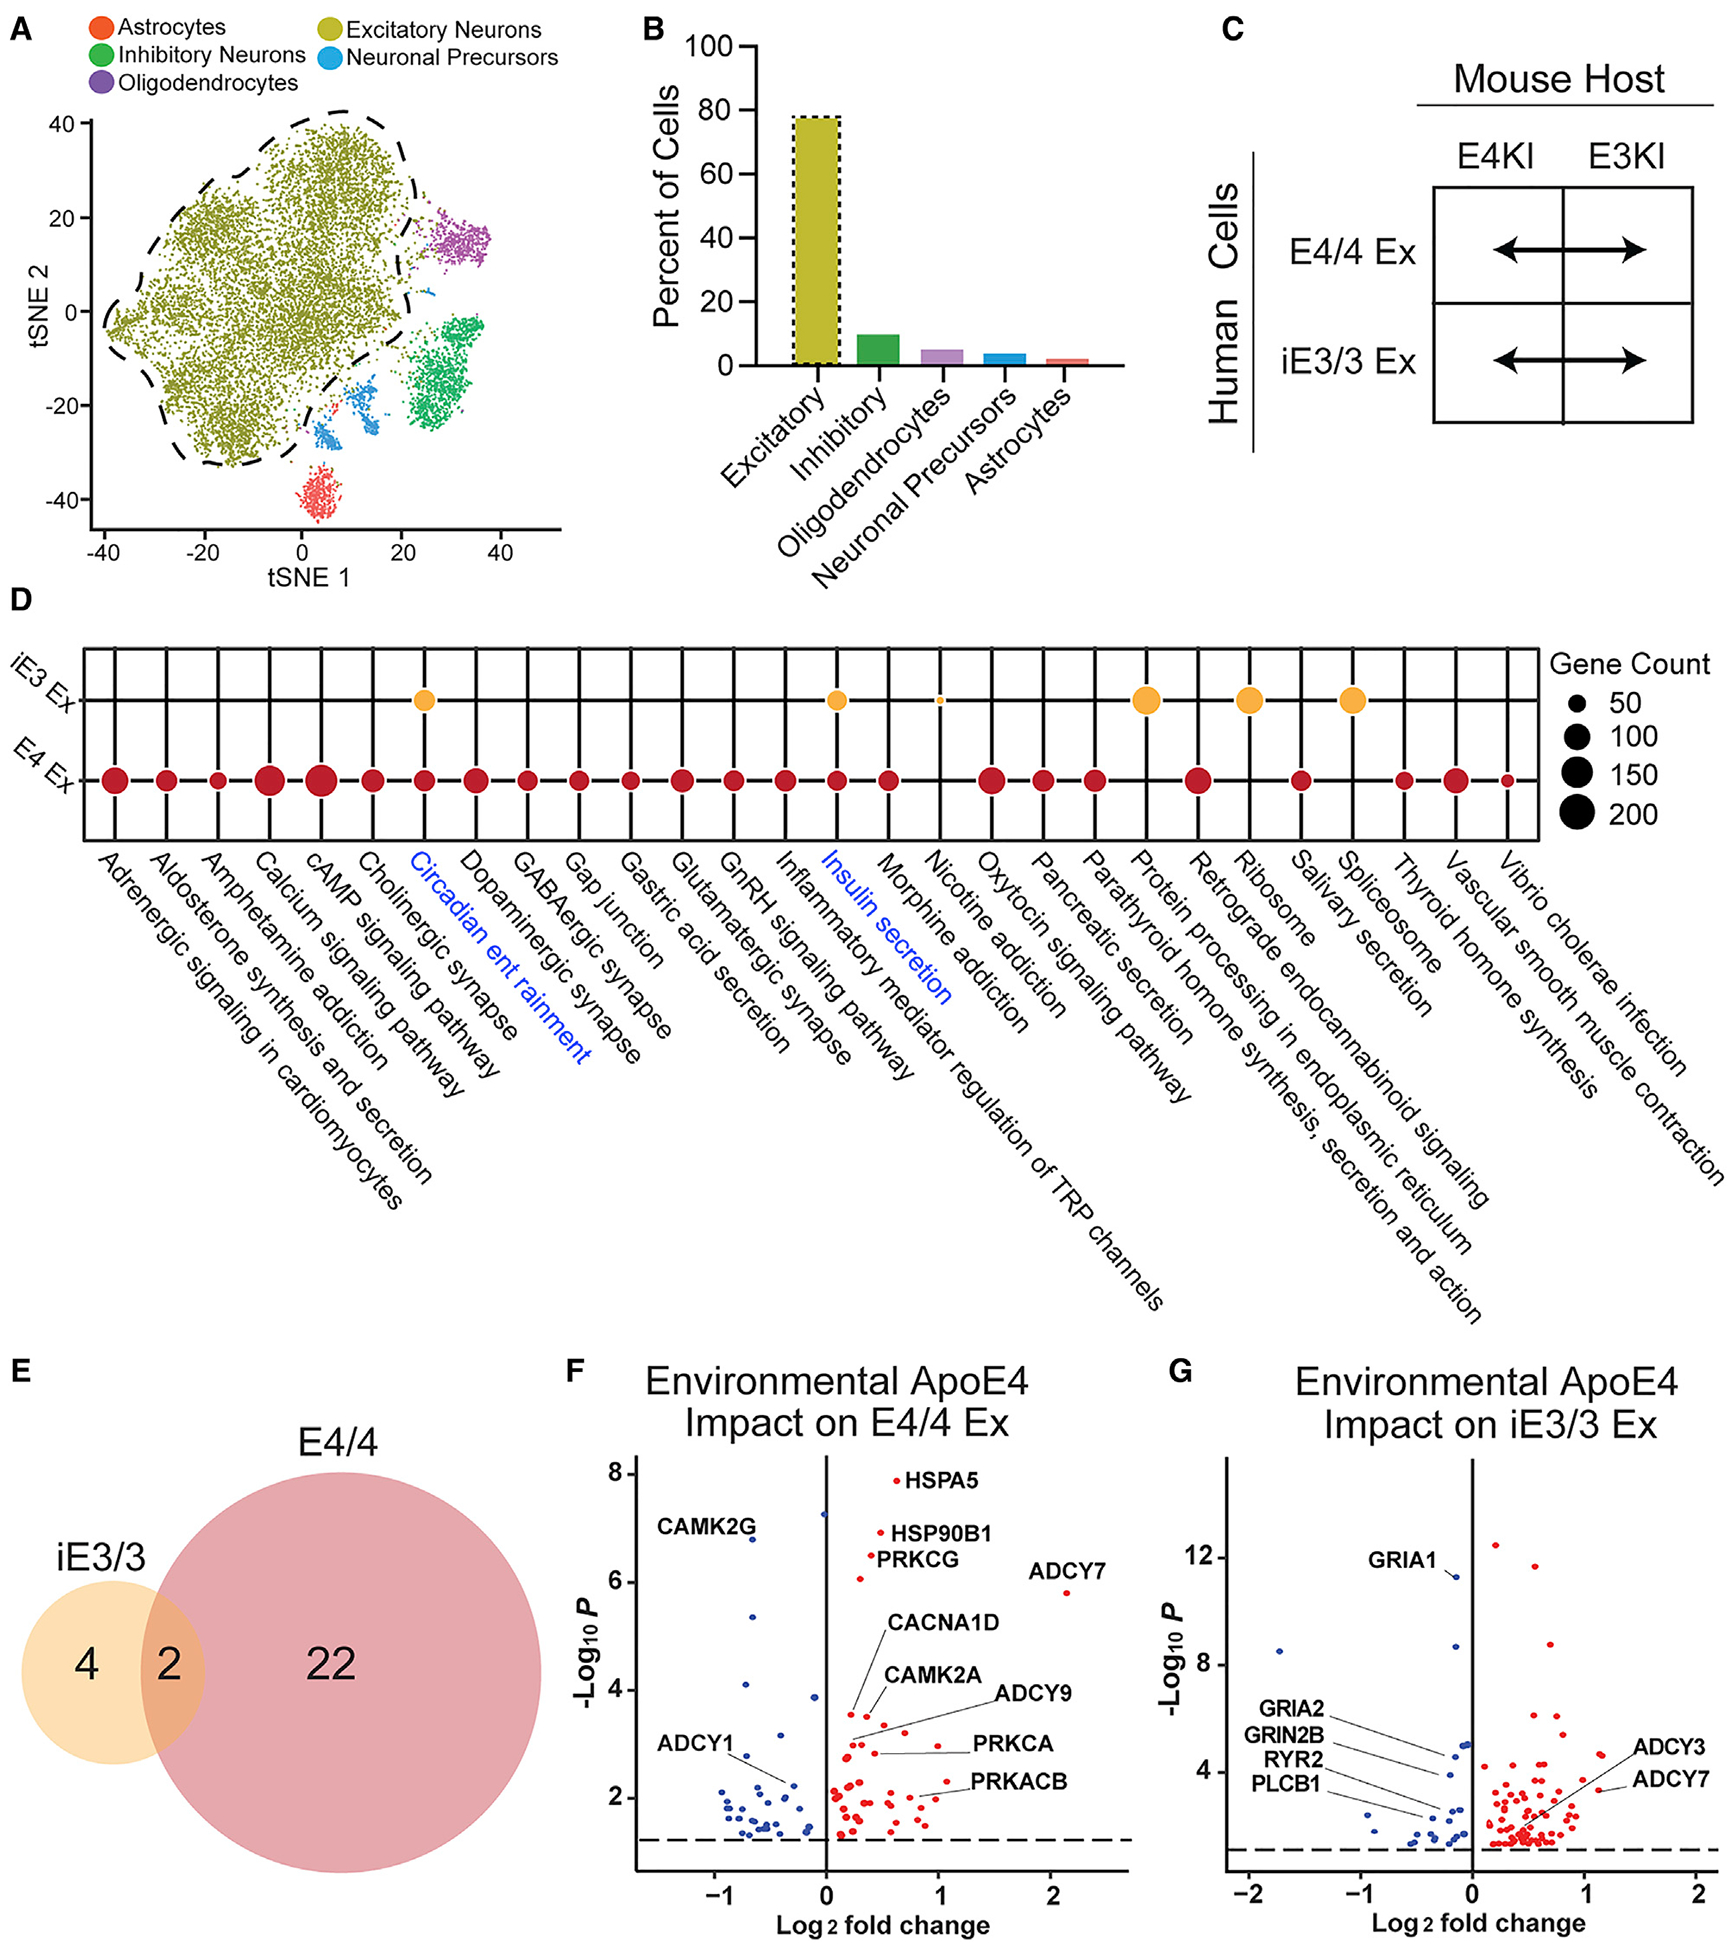
Figure 4. Differential Responses of iE3/3 and E4/4 Human Excitatory Neurons to Environmental (Exogenous) ApoE4.

(A) tSNE clustering indicating a human excitatory neuron cluster.
(B) Quantification of cell-type percentages represented in isolated transplanted human neurons (excitatory neurons outlined by the dotted line).
(C) These comparisons were made for apoE-genotype-matched hiPSC-derived excitatory neurons across E4KI and E3KI mouse hosts.
(D) Dotplot displaying the pathways dysregulated by the E4KI mouse host environment in E4/4-hiPSC-derived excitatory neurons and iE3/3-hiPSC-derived excitatory neurons. Node size indicates the number of genes dysregulated within the pathway. Shared pathways are highlighted in blue.
(E) Many more pathways were dysregulated by the E4KI mouse host environment in E4/4-hiPSC-derived excitatory neurons (right) than in iE3/3-hiPSC-derived excitatory neurons (left).
(F and G) Genes dysregulated by the E4KI mouse environment in E4/4-hiPSC-derived excitatory neurons (F). Genes dysregulated by the E4KI mouse environment in iE3/3-hiPSC-derived excitatory neurons (G). Red points represent an increase in log2 fold change and blue points represent a decrease in log2 fold change in response to the E4KI brain environment. Only genes with a Benjamini-Hochberg corrected p < 0.05 are shown. The p values are assigned per cell.
In (C), (D), (F), and (G), Ex denotes excitatory neurons.
