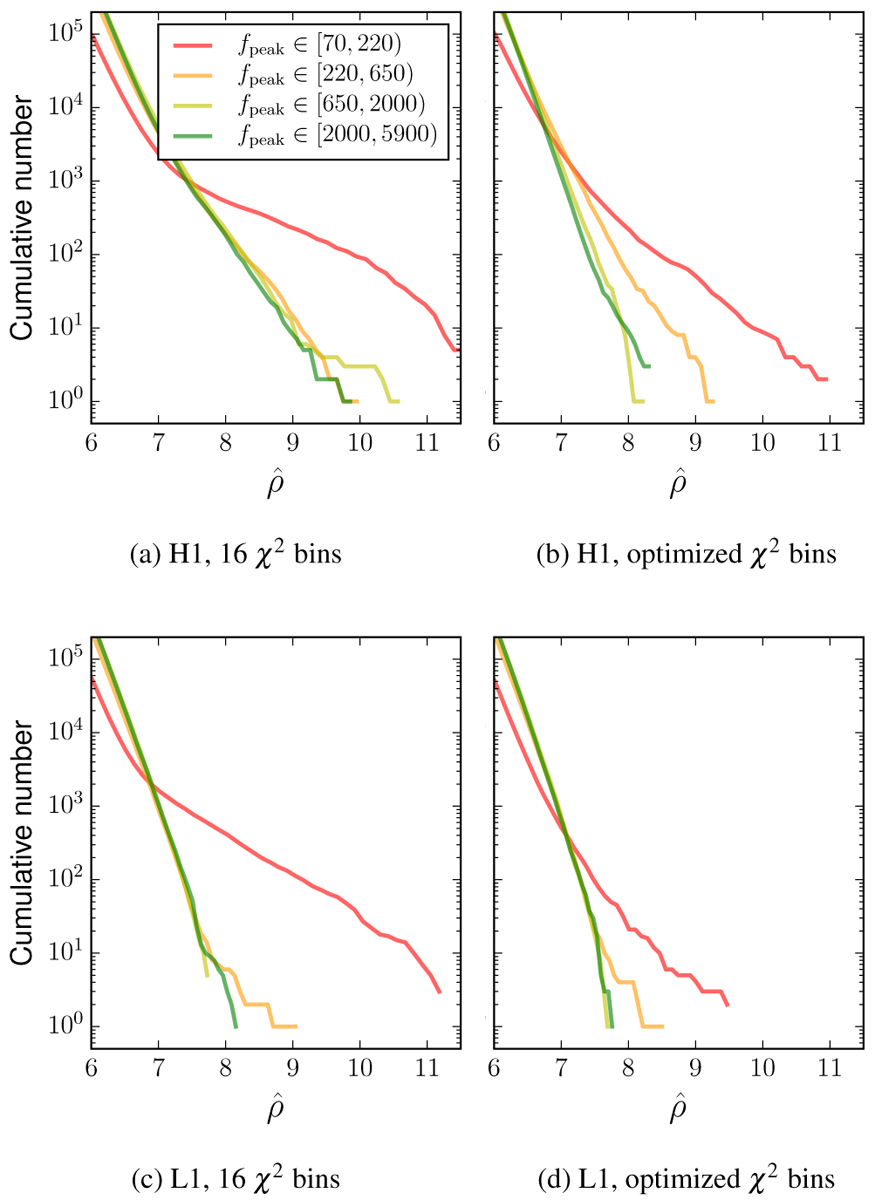
FIG. 4.

Distributions of noise triggers over re-weighted SNR , for Advanced LIGO engineering run data taken between September 2 and September 9, 2015. Each line shows triggers from templates within a given range of gravitational-wave frequency at maximum strain amplitude, fpeak. Left: Triggers obtained from H1, L1 data respectively, using a fixed number of p = 16 frequency bands for the χ2 test. Right: Triggers obtained with the number of frequency bands determined by the function p = ⌊0.4(fpeak/Hz)2/3⌋. Note that while noise distributions are suppressed over the whole template bank with the optimized choice of p, the suppression is strongest for templates with lower fpeak values. Templates that have a fpeak < 220Hz produce a large tail of noise triggers with high re-weighted SNR even with the improved χ2-squared test tuning, thus we separate these templates from the rest of the bank when calculating the noise background.
