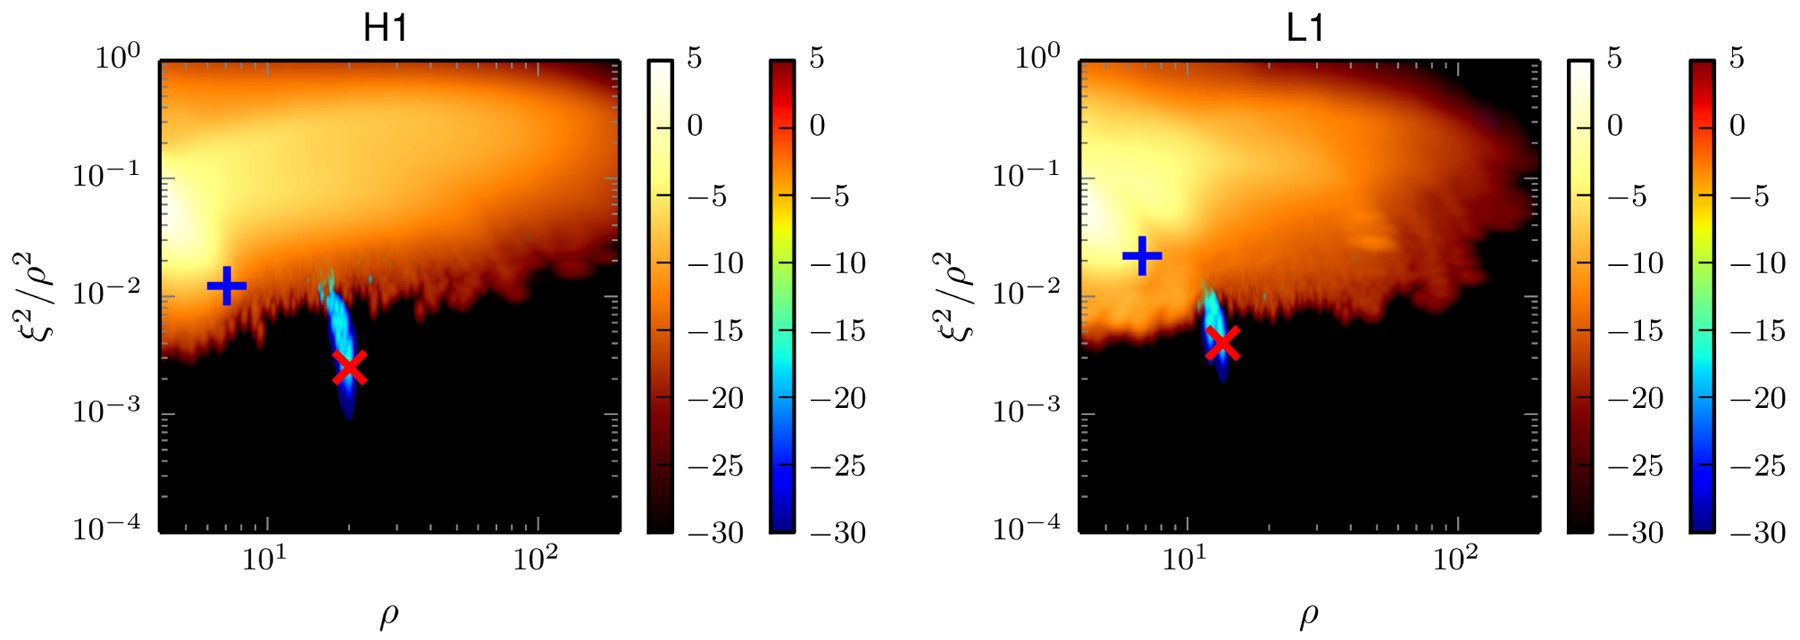
FIG. 6.

Two projections of parameters in the multi-dimensional likelihood ratio ranking for GstLAL (Left: H1, Right: L1). The relative positions of GW150914 (red cross) and LVT151012 (blue plus) are indicated in the ξ2/ρ2 vs matched-filter SNR plane. The yellow–black colormap shows the natural logarithm of the probability density function calculated using only coincident triggers that are not coincident between the detectors. This is the background model used in the likelihood ratio calculation. The red–blue colormap shows the natural logarithm of the probability density function calculated from both coincident events and triggers that are not coincident between the detectors. The distribution showing both candidate events and non-coincident triggers has been masked to only show regions which are not consistent with the background model. Rather than showing the θi bins in which GW150914 and LVT151012 were found, θi has been marginalized over to demonstrate that no background triggers from any bin had the parameters of GW150914.
