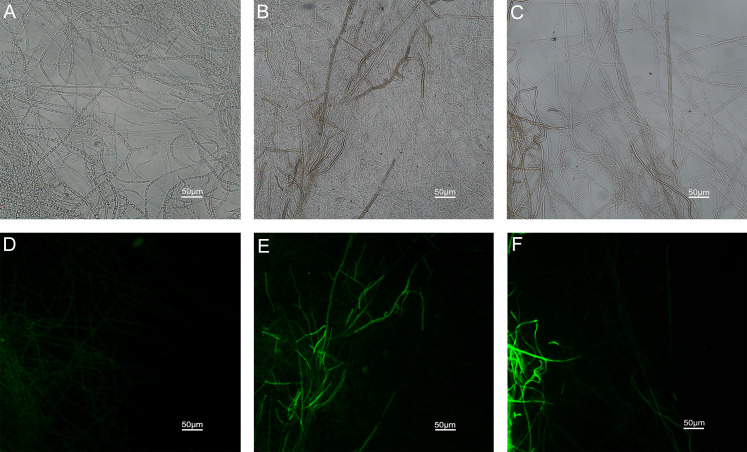
Figure 9. Effects of carvacrol and thymol on mitochondrial integrity measured by fluorescence microscope.
(Nikon Eclipse Ti-S, Japan) with 200× magnifications. First row: bright field. Second row: rhodamine 123. (A) and (D) untreated; (B) and (E) treated with carvacrol at 200 μg/mL; (C) and (F) treated with thymol at 200 μg/mL.

