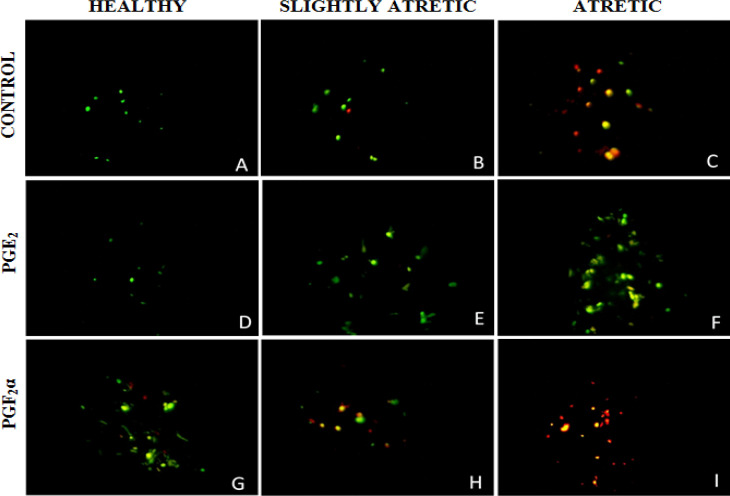
Fig. 3.
Fluorescent photographs of granulosa cells of ovarian antral follicles after PGE2 treatment at 1.0 μg/ml (D, E, F) and PGF2α treatment at 1.0 μg/ml (G, H, I) in comparison with control (A, B, C) stained with fluorescent dye AO depicting apoptotic granulosa cells with bright red fluorescence and normal live cells with green fluorescence after 24 h culture at ×400

