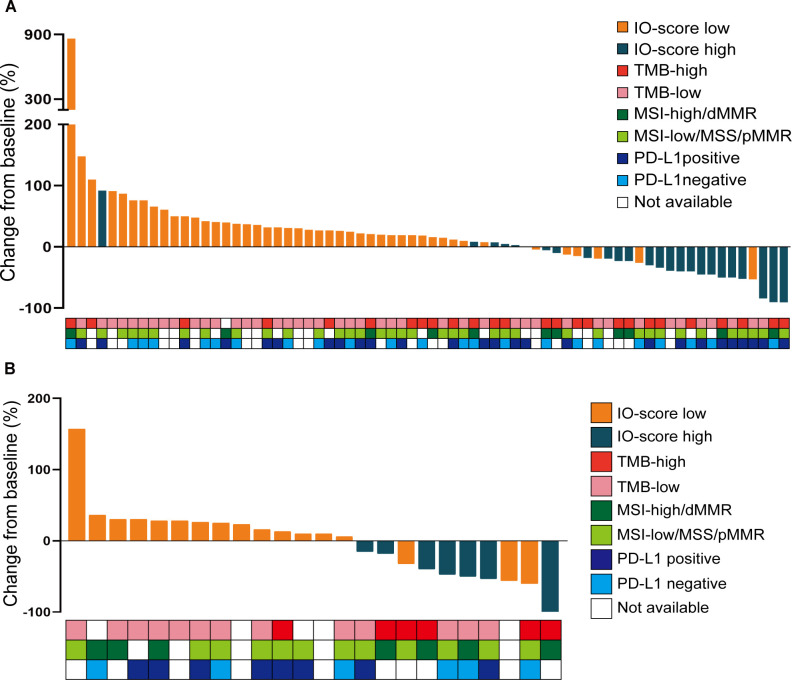
Figure 4.
Waterfall plot of the response of patients with gastrointestinal cancers to ICIs. (A) Waterfall plot showing the candidate biomarkers in the discovery cohort. The Y-axis represents the percentage change in the summed longest diameters of the target lesions from baseline. (B) Waterfall plot showing the results for the validation cohort. dMMR, deficient mismatch repair; ICIs, immune checkpoint inhibitors; IO, immune oncology; MSI, microsatellite instability; MSS, microsatellite stability; PD-L1, programmed death ligand 1; pMMR, proficient mismatch repair; TMB, tumor mutational burden.

