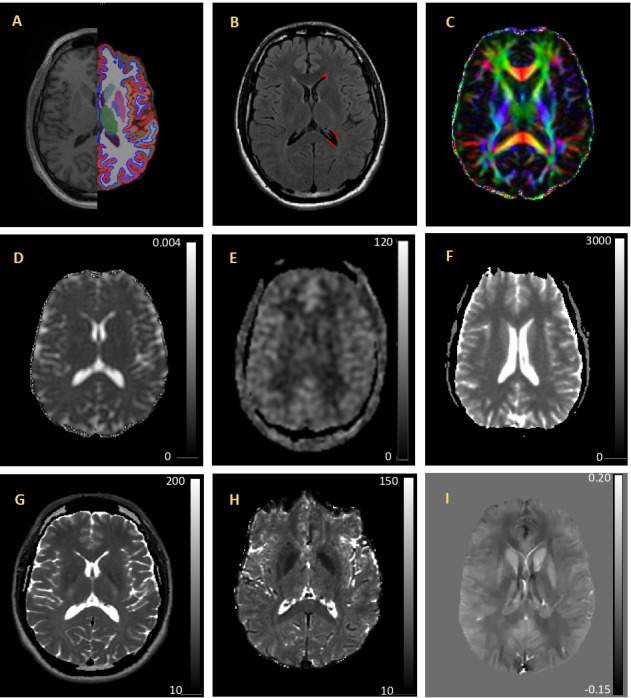
Figure 2.

Example quantitative imaging maps and associated processing overlays. (A) 3D-T1 image shown with FreeSurfer segmentation and parcellation results overlay on the left hemisphere. (B) FLAIR with WMH mask (red) on the left hemisphere. (C) FA colour map indicating the primary diffusion direction of white matter tracts (red indicates left/right; green indicates anterior/posterior; and blue indicates inferior/superior). (D) MD map with voxel intensity values are in mm2/s. (E) CBF map. Voxel intensity values are in mm/min/100 g tissue. (F) Quantitative T1 map. Voxel intensity values are in ms. (G) T2 map voxel intensity values are in ms. (H) T2* map. Voxel intensity values are in ms. (I) Quantitative susceptibility map. Voxel intensity values are in PPM. All images are from the same individual and are shown in radiological orientation. CBF, cerebral blood flow; FA, fractional anisotropy; FLAIR, fluid attenuated inversion recovery; PPM, parts per million; WMH, white matter hyperintensity.
