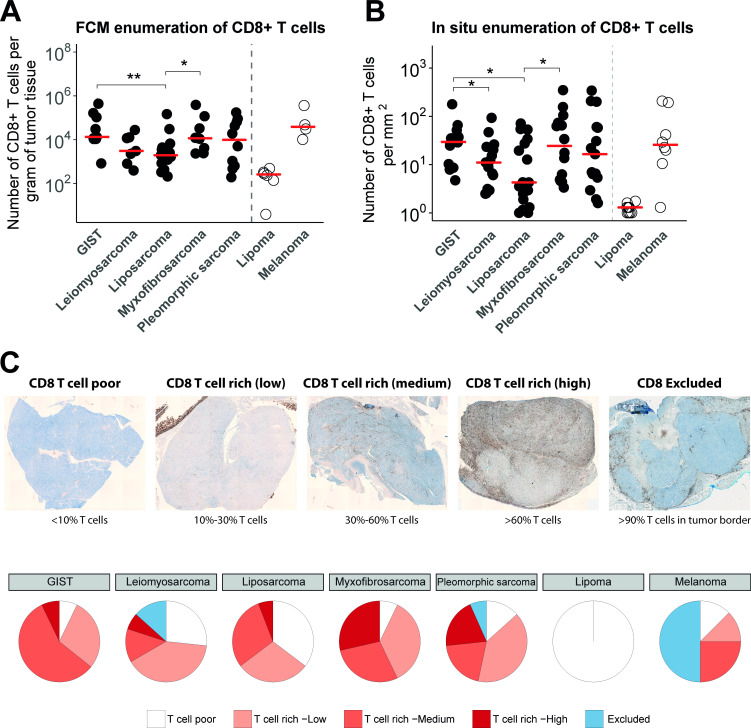
Figure 1.
(A) Absolute numbers of CD8+ T cells per gram of tumor tissue assessed by FCM after tissue dissociation of surgical specimen of GIST (n=9), leiomyosarcoma (n=7), liposarcoma (n=12), myxofibrosarcoma (n=8), pleomorphic sarcoma (n=9), lipoma (n=5) and melanoma (n=4). Individual (symbols) and median (horizontal lines) observations are shown, Kruskal-Wallis test: p = 0.049. (B) Quantification of CD8+ T cells in IHC stainings per square millimetre in formalin-fixed and paraffin-embedded tissue sections of different STS subtypes (n=15 specimen per STS subtype), Kruskal-Wallis test: p = 0.038. (C) Upper panel, representative IHC stainings of different categories of CD8+ T-cell distributions (brightfield whole slide images; see Materials and methods section for details); lower panel: pie charts displaying the frequencies of the different categories of T-cell distributions for the different STS subtypes. *, represents p value of <0.05 according to the Mann-Whitney U test. **, represents p value of <0.01 and ***, represents p value of <0.001. FCM, flow cytometry; GIST, gastrointestinal stromal tumor; IHC, immunohistochemistry; STS, soft tissue sarcoma.

