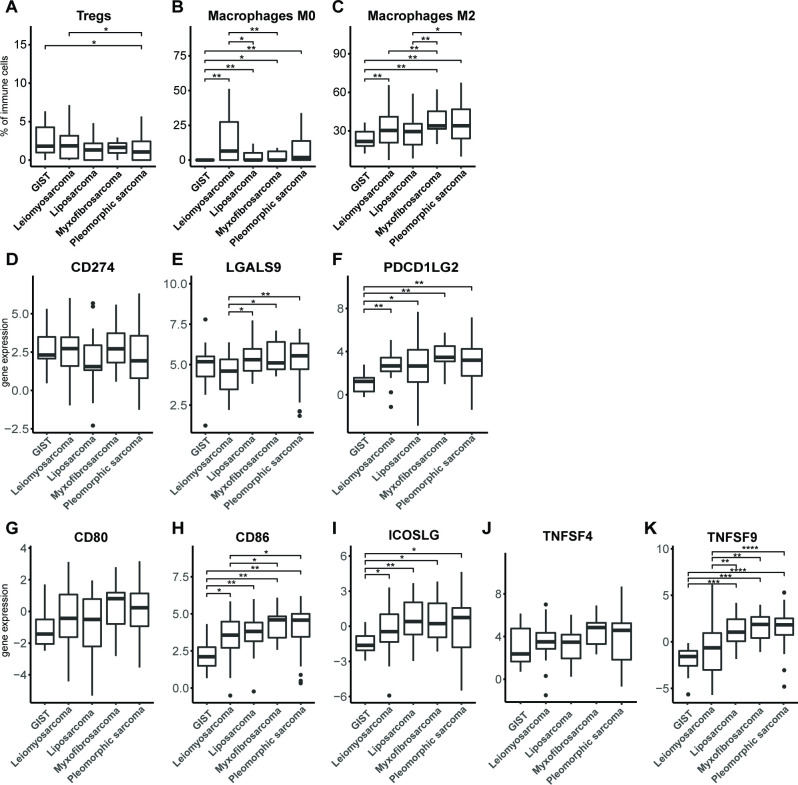
Figure 6.
Fractions of immune cell subtypes (A) regulatory T cells, (B) M0 macrophages and (C) M2 macrophages in different STS subtypes as determined by CIBERSORT algorithm according to publicly available RNA data. RNA expression of (D) PDL1 (CD274), (E) Galectin-9 (LGALS9) and (F) PDL2 (PDCD1LG2), in different STS subtypes according to publicly available data and displayed as box and whisker plots. RNA expression of (G) CD80, (H) CD86, (I) ICOS ligand, (J) OX40 ligand (TNFSF4), and (K) 4-1BB ligand (TNFSF9) in different STS subtypes according to publicly available data and displayed as box and whisker plots. The number of analyzed tumors per STS subtype is described in the Materials and methods section. *, represents p value of <0.05 according to the Mann-Whitney U test. GIST, gastrointestinal stromal tumor; STS, soft tissue sarcoma.

