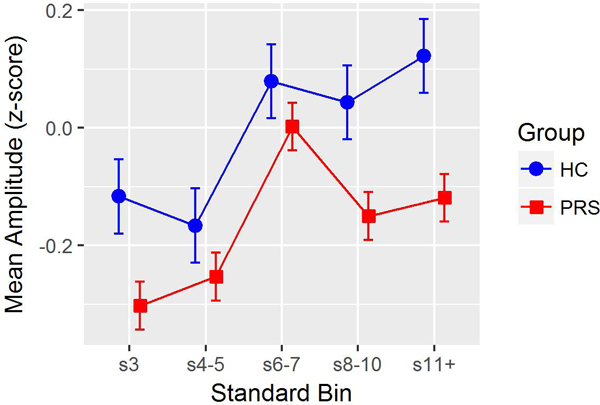
Figure 2.

Age- and site-adjusted repetition positivity (RP) amplitude z-scores at each standard repetition position (difference scores from s2 RP), by Baseline Group (Healthy Controls, HC; Psychosis Risk Syndrome (PRS). Line plots illustrate a main effect of group, with PRS showing less RP amplitude across all standard repetition positions.
