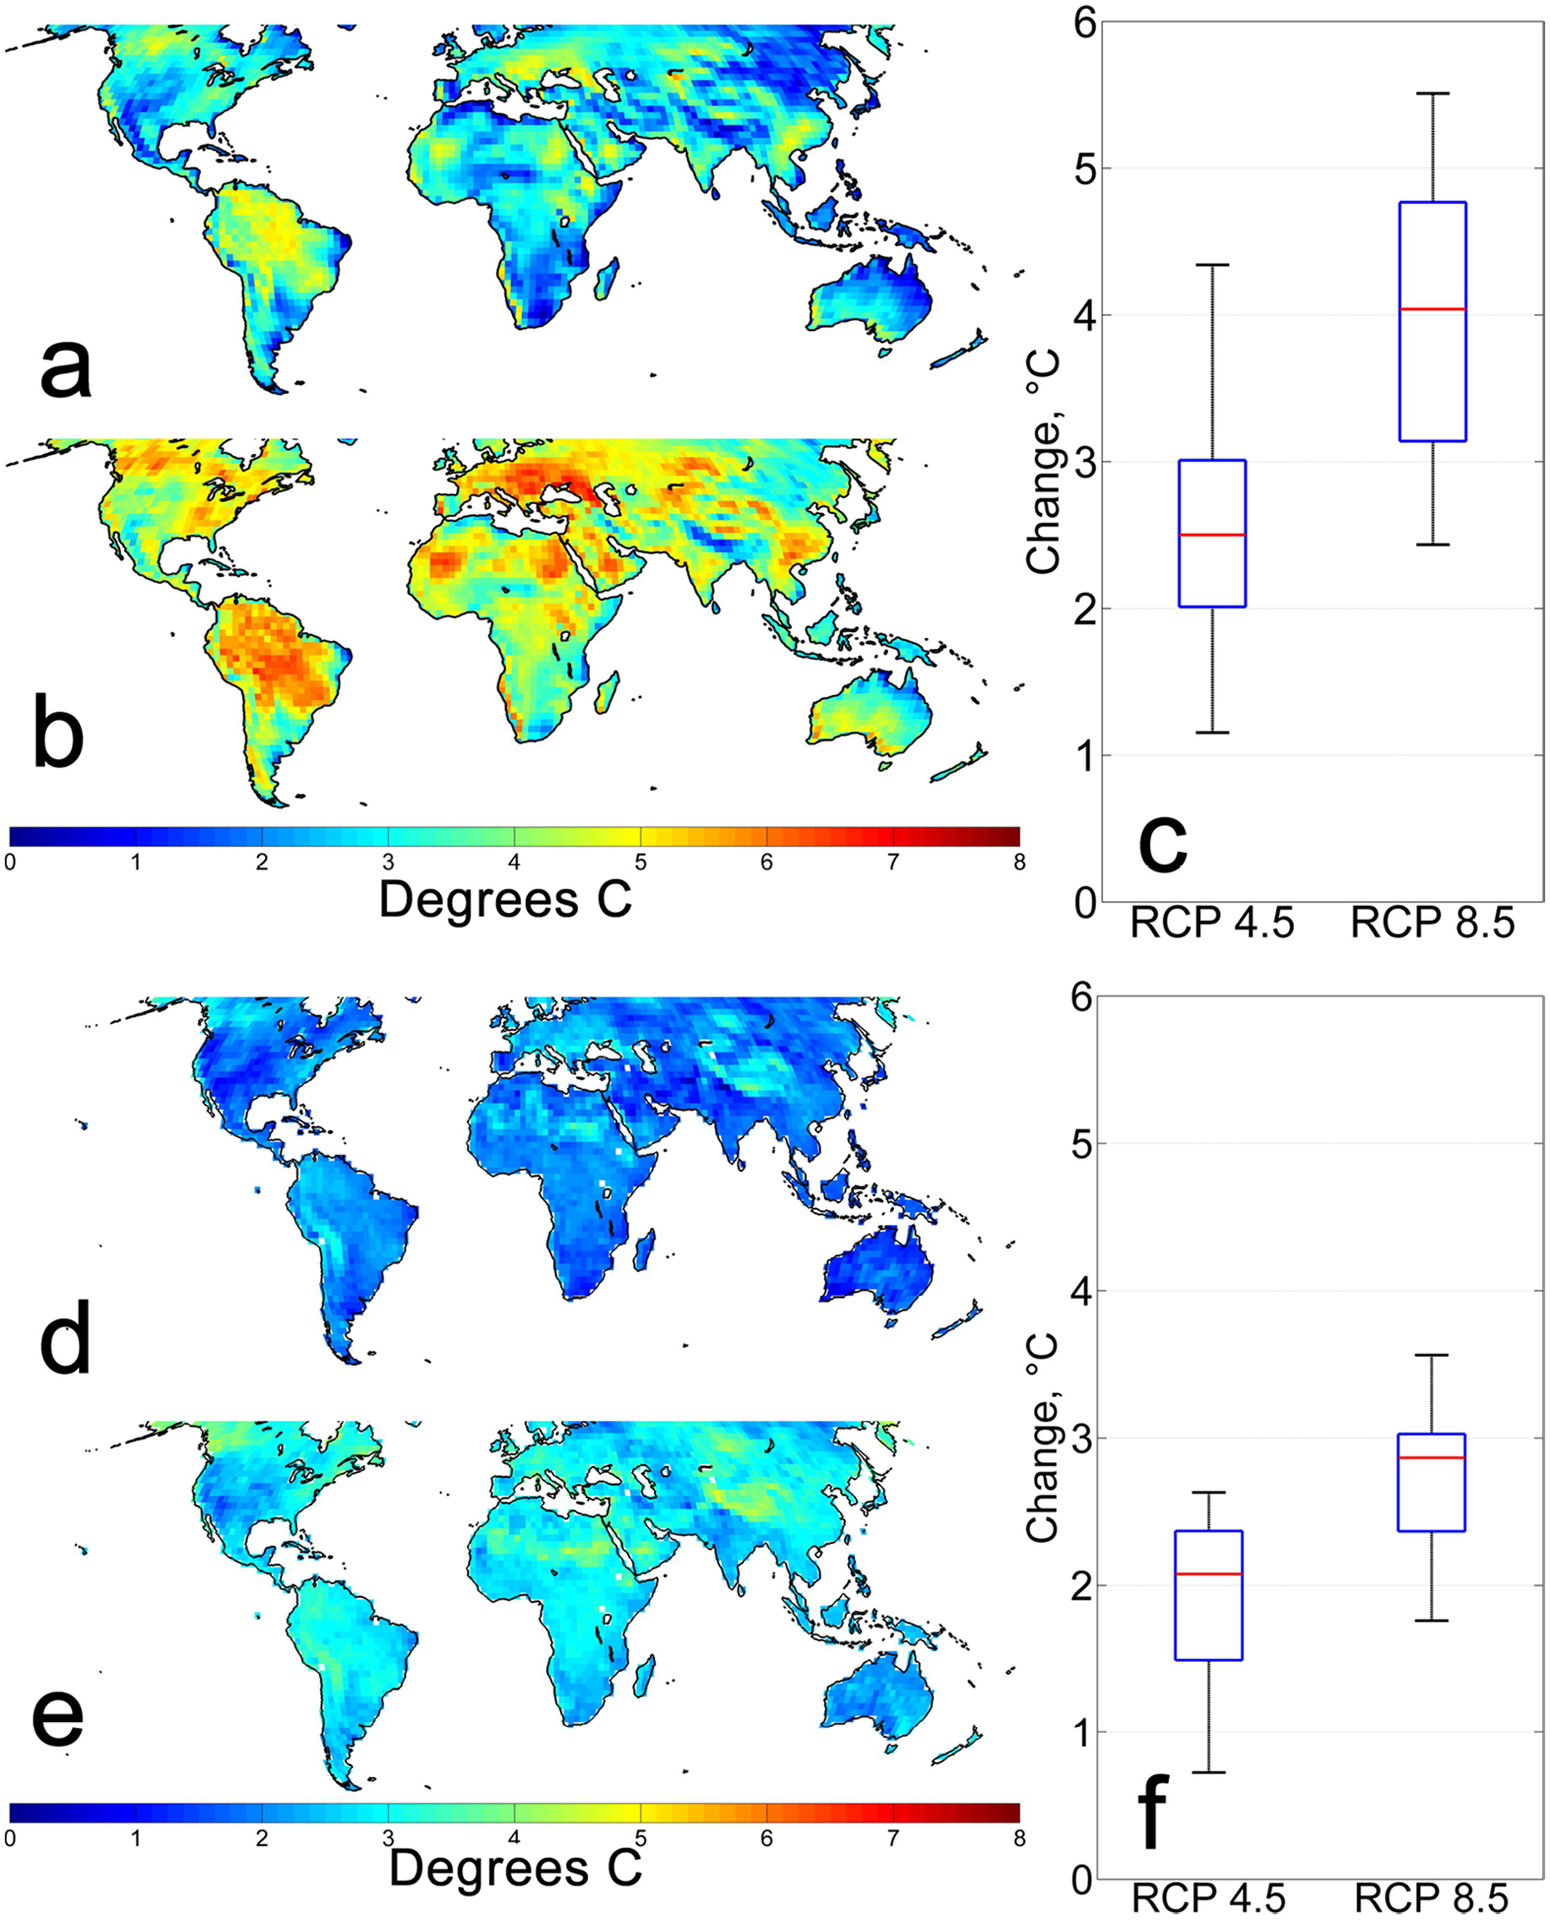
Figure 1:

Top panel (a-c): changes in annual maximum air temperature in 2060 – 2080 relative to 1985 – 2005 under RCP 4.5 (a) and RCP 8.5 (b). Panel (c) shows the range in projected annual maximum temperature increase spatially averaged over land for both emission scenarios over all 18 CMIP5 GCMs. Bottom panel (d-f): same as (a-c) except for annual maximum wet bulb temperature. Air temperatures increase at a faster rate and have more spatial variability than wet bulb temperatures, in part due to the dependence of wet bulb temperature on humidity.
