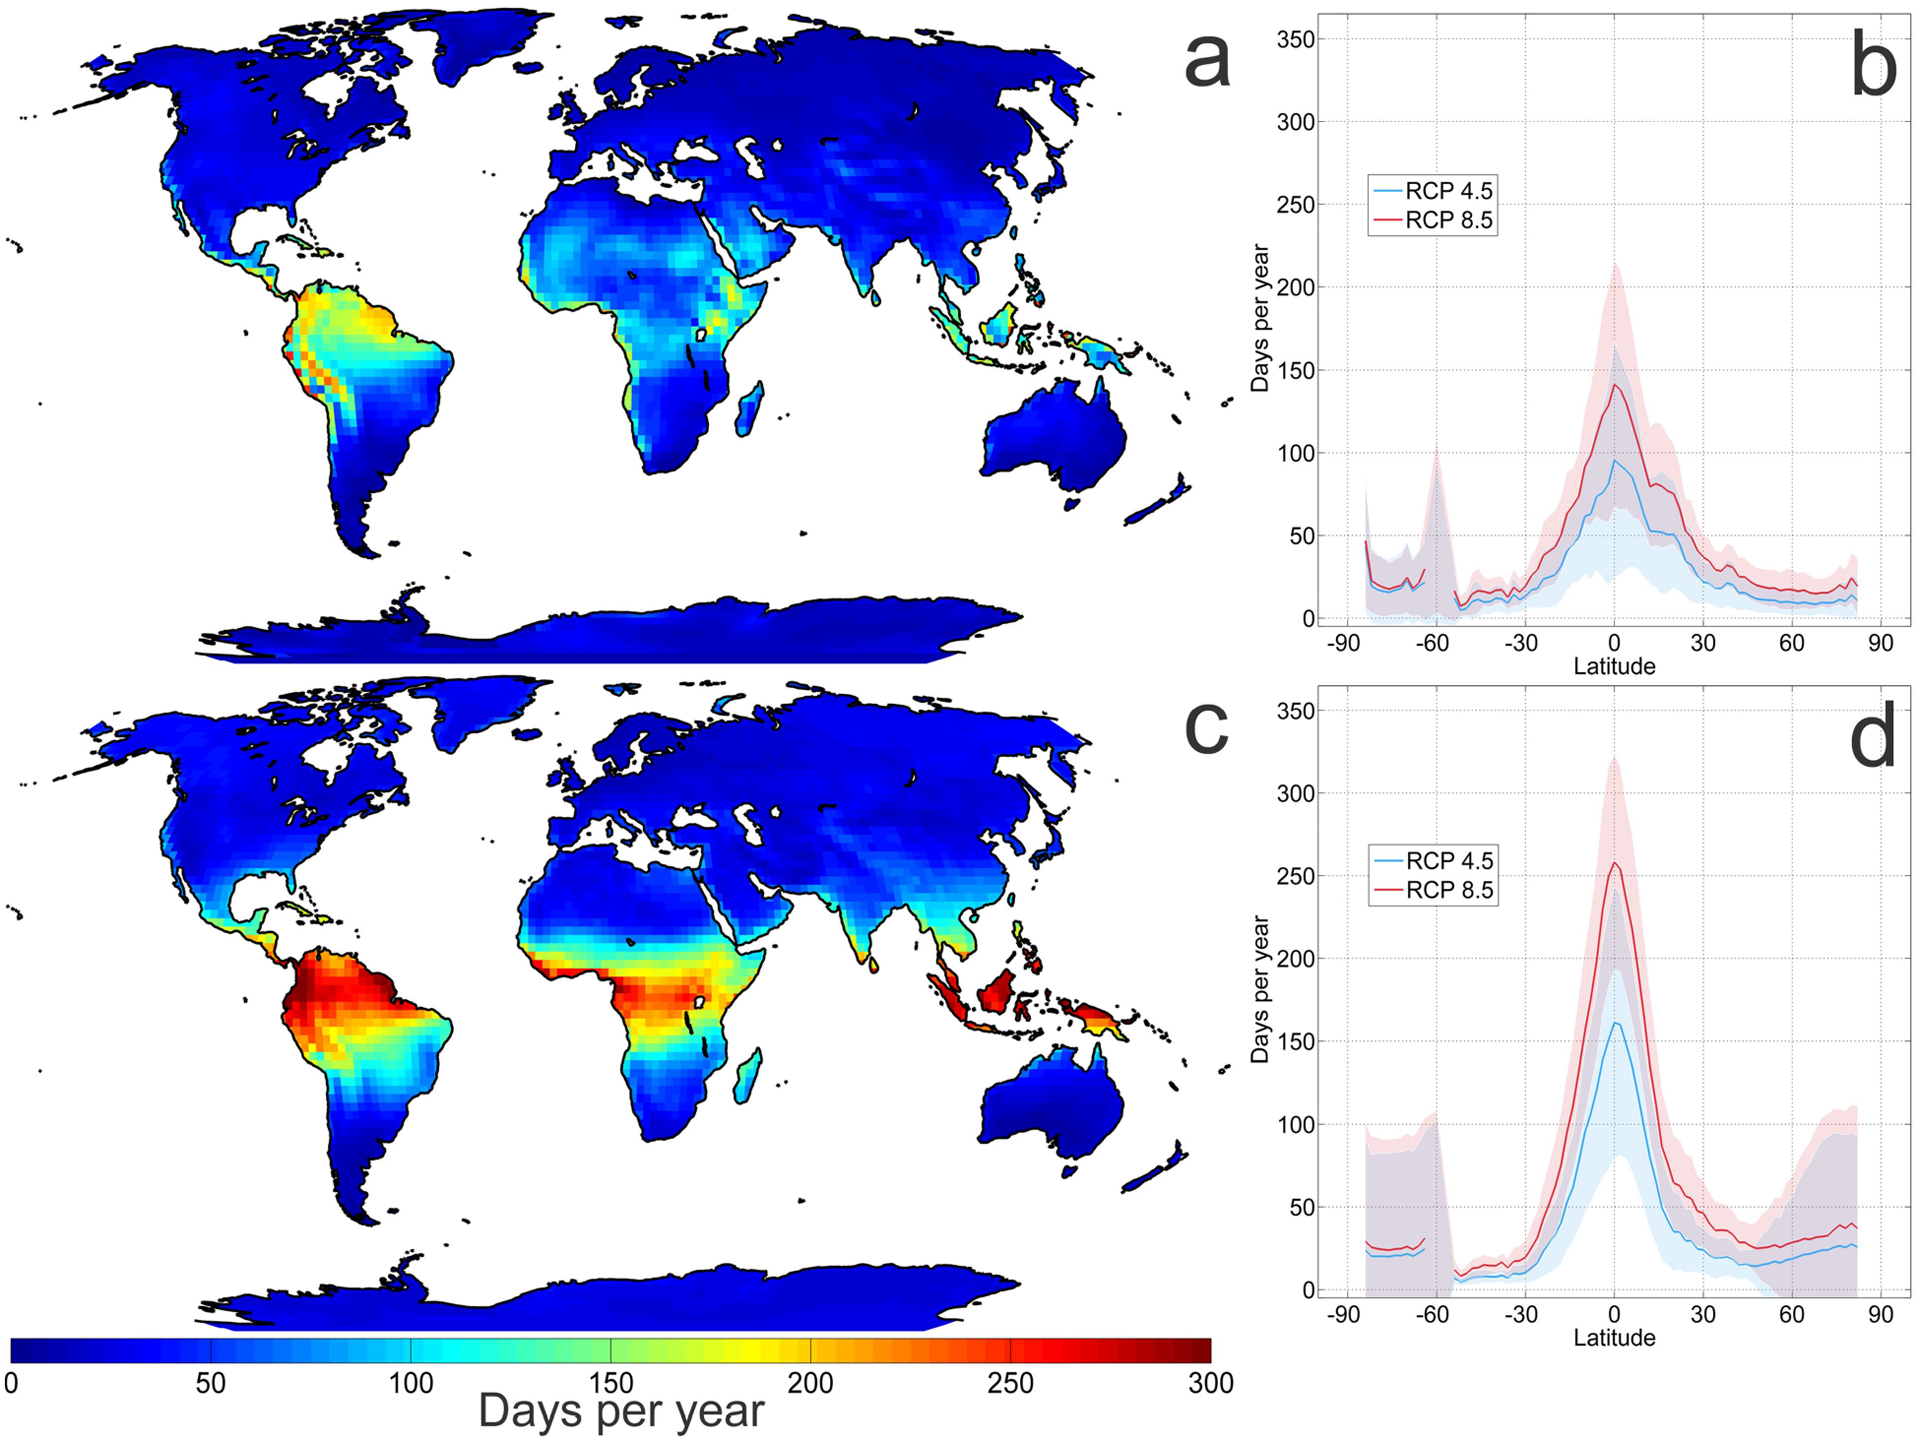
Figure 2:

The number of days per year which exceed the historical (1985–2005) mean annual maximum temperature (top row) and wet bulb temperature (bottom row) in 2060 – 2080. Maps show results under RCP 8.5 (see Supplementary Figure 8 for maps under RCP 4.5), and (b, d) show the variation with latitude of the number of days per year under both RCP 4.5 and RCP 8.5, excluding water grid cells. Wet bulb temperatures exceed the historical mean annual maximum more frequently than air temperatures due to lower variability, especially in the tropics.
