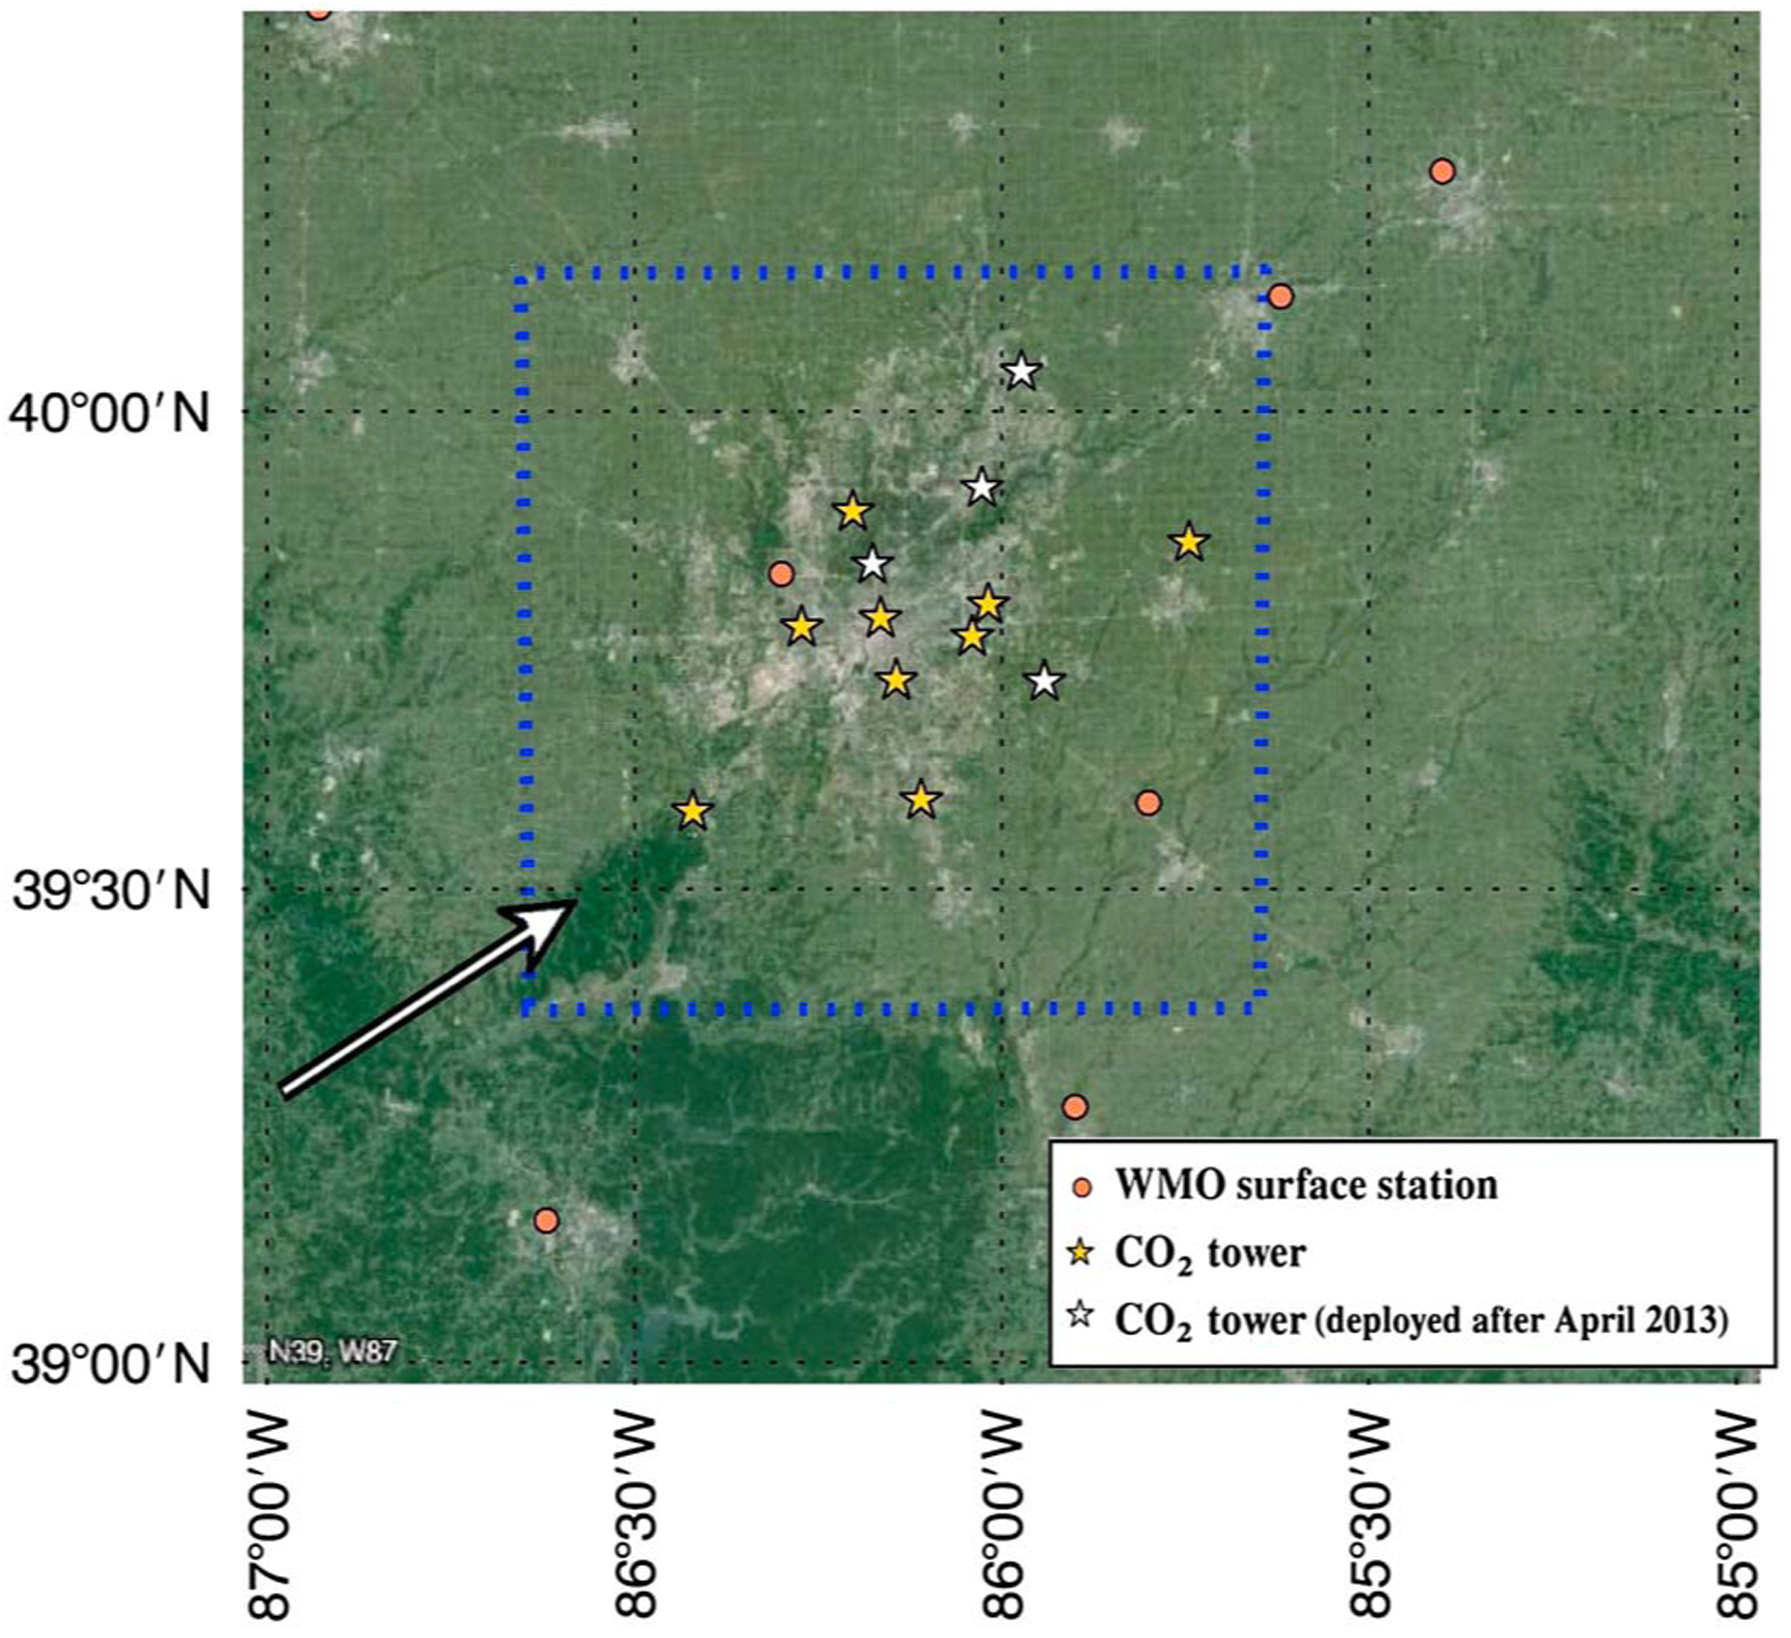
Figure 2.

CO2 tower locations (gold stars) in the 1 km simulation domain (blue square), with additional towers not available for the study period (white stars), and surface meteorological stations (red circles) from the WMO database used in the WRF-FDDA modeling system. Indianapolis is located at the center of the domains.
