
Figure 4.
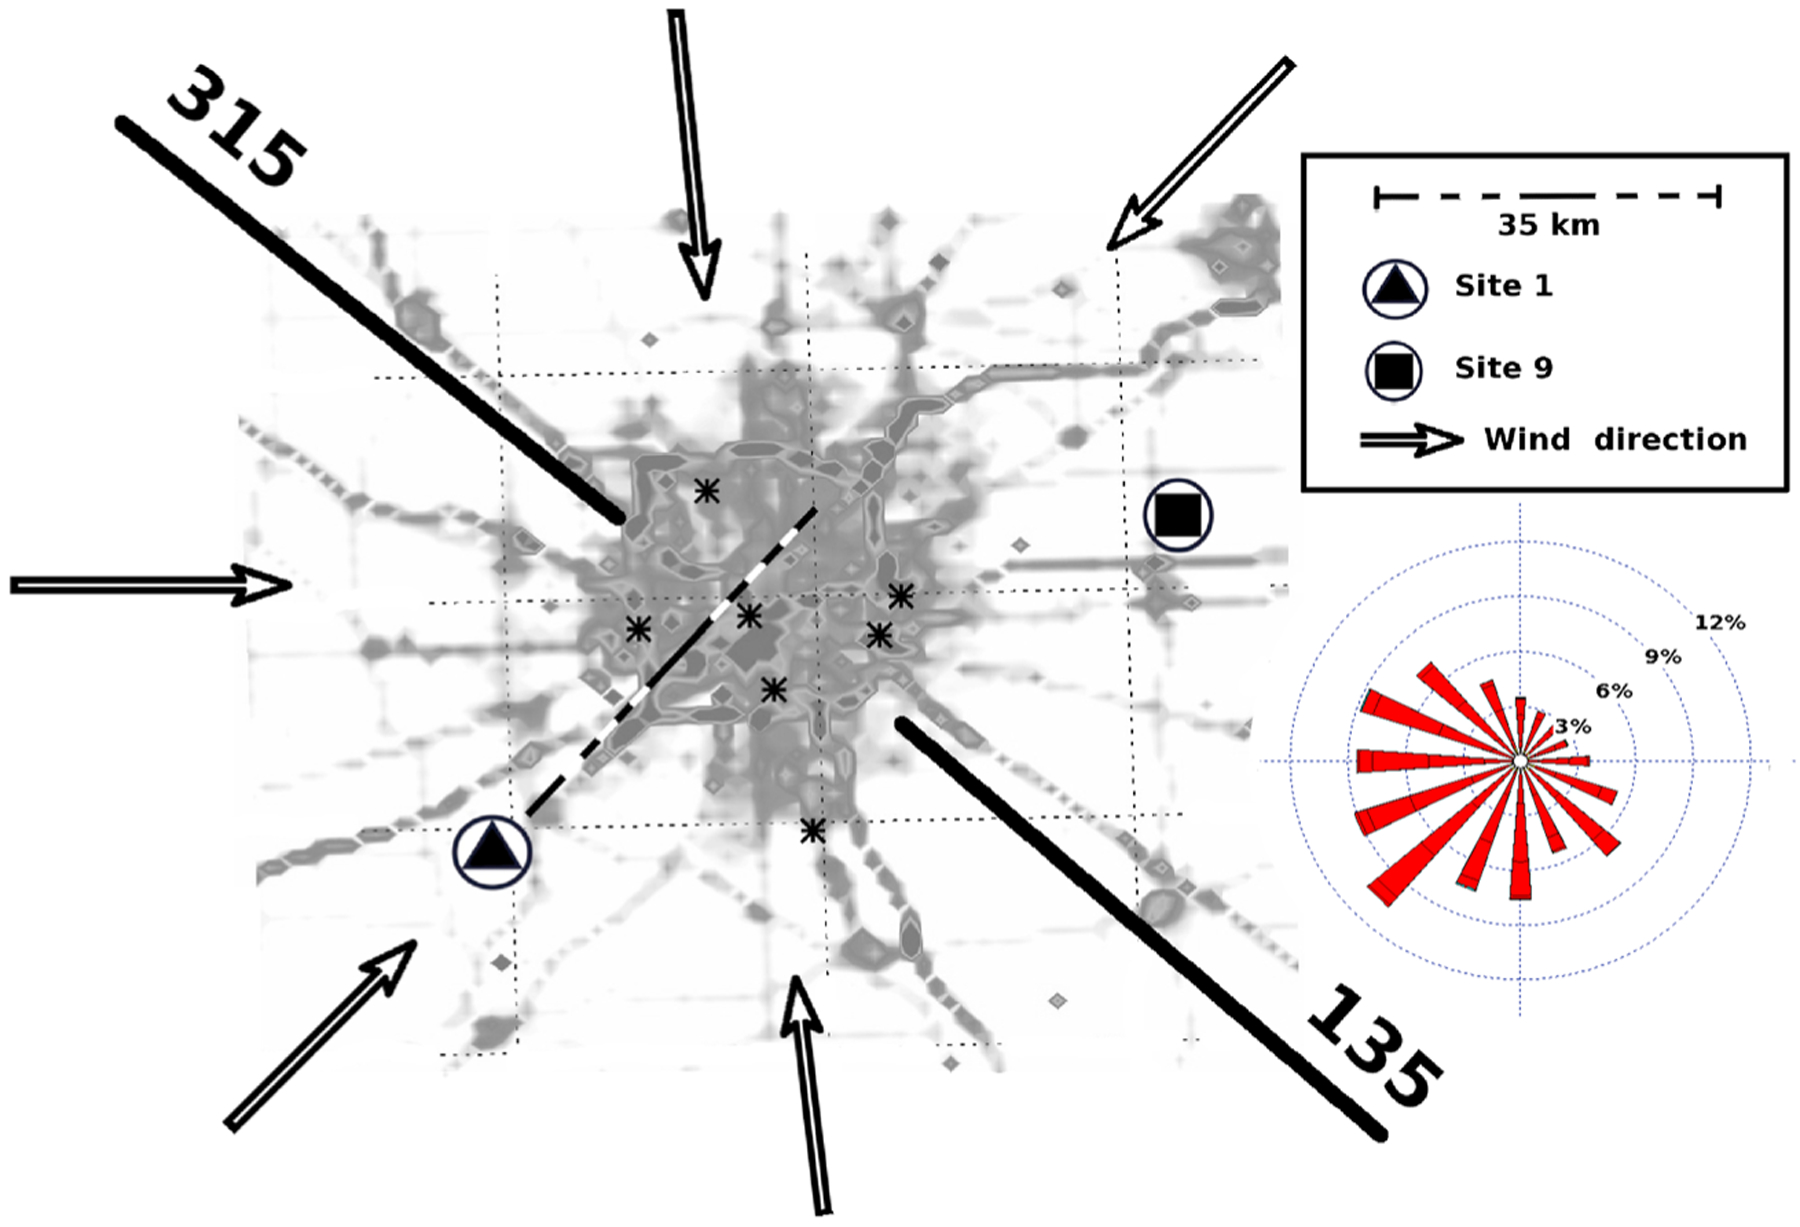
Selection of the background site to determine the upwind concentrations of CO2 over Indianapolis, using two semicircles (135° and 315°) and hourly modeled wind directions from the WRF-FDDA system at three locations across the city. The emitting area defined by Hestia is represented in gray. The distance between Site 1 and Site 9 (about 35 km) corresponds to an advection time of about 2 h. The wind climatology for the month of December at the Indianapolis airport (IND station) is shown under the legend (in red).