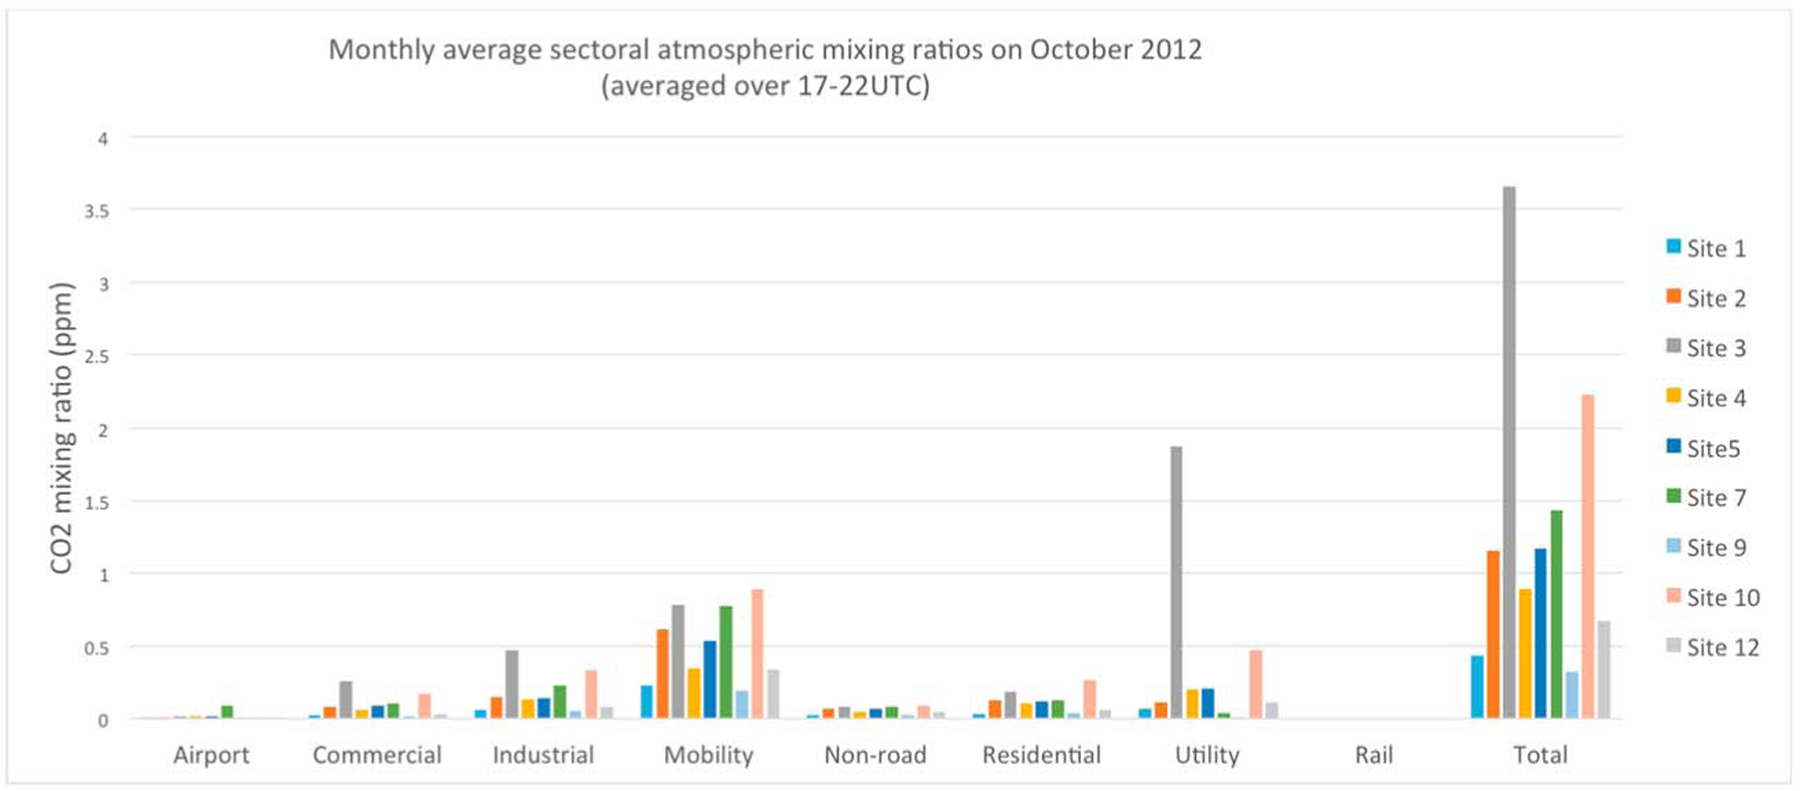
Figure 5.

Sectoral contributions (in ppm) using the WRF-FDDA-LPDM footprints at 1 km resolution combined with the Hestia sectoral CO2 emissions for October 2012, except for the Railroad and the airport sectors representing about 2% of the emissions and the atmospheric enhancements.
