
Figure 8.
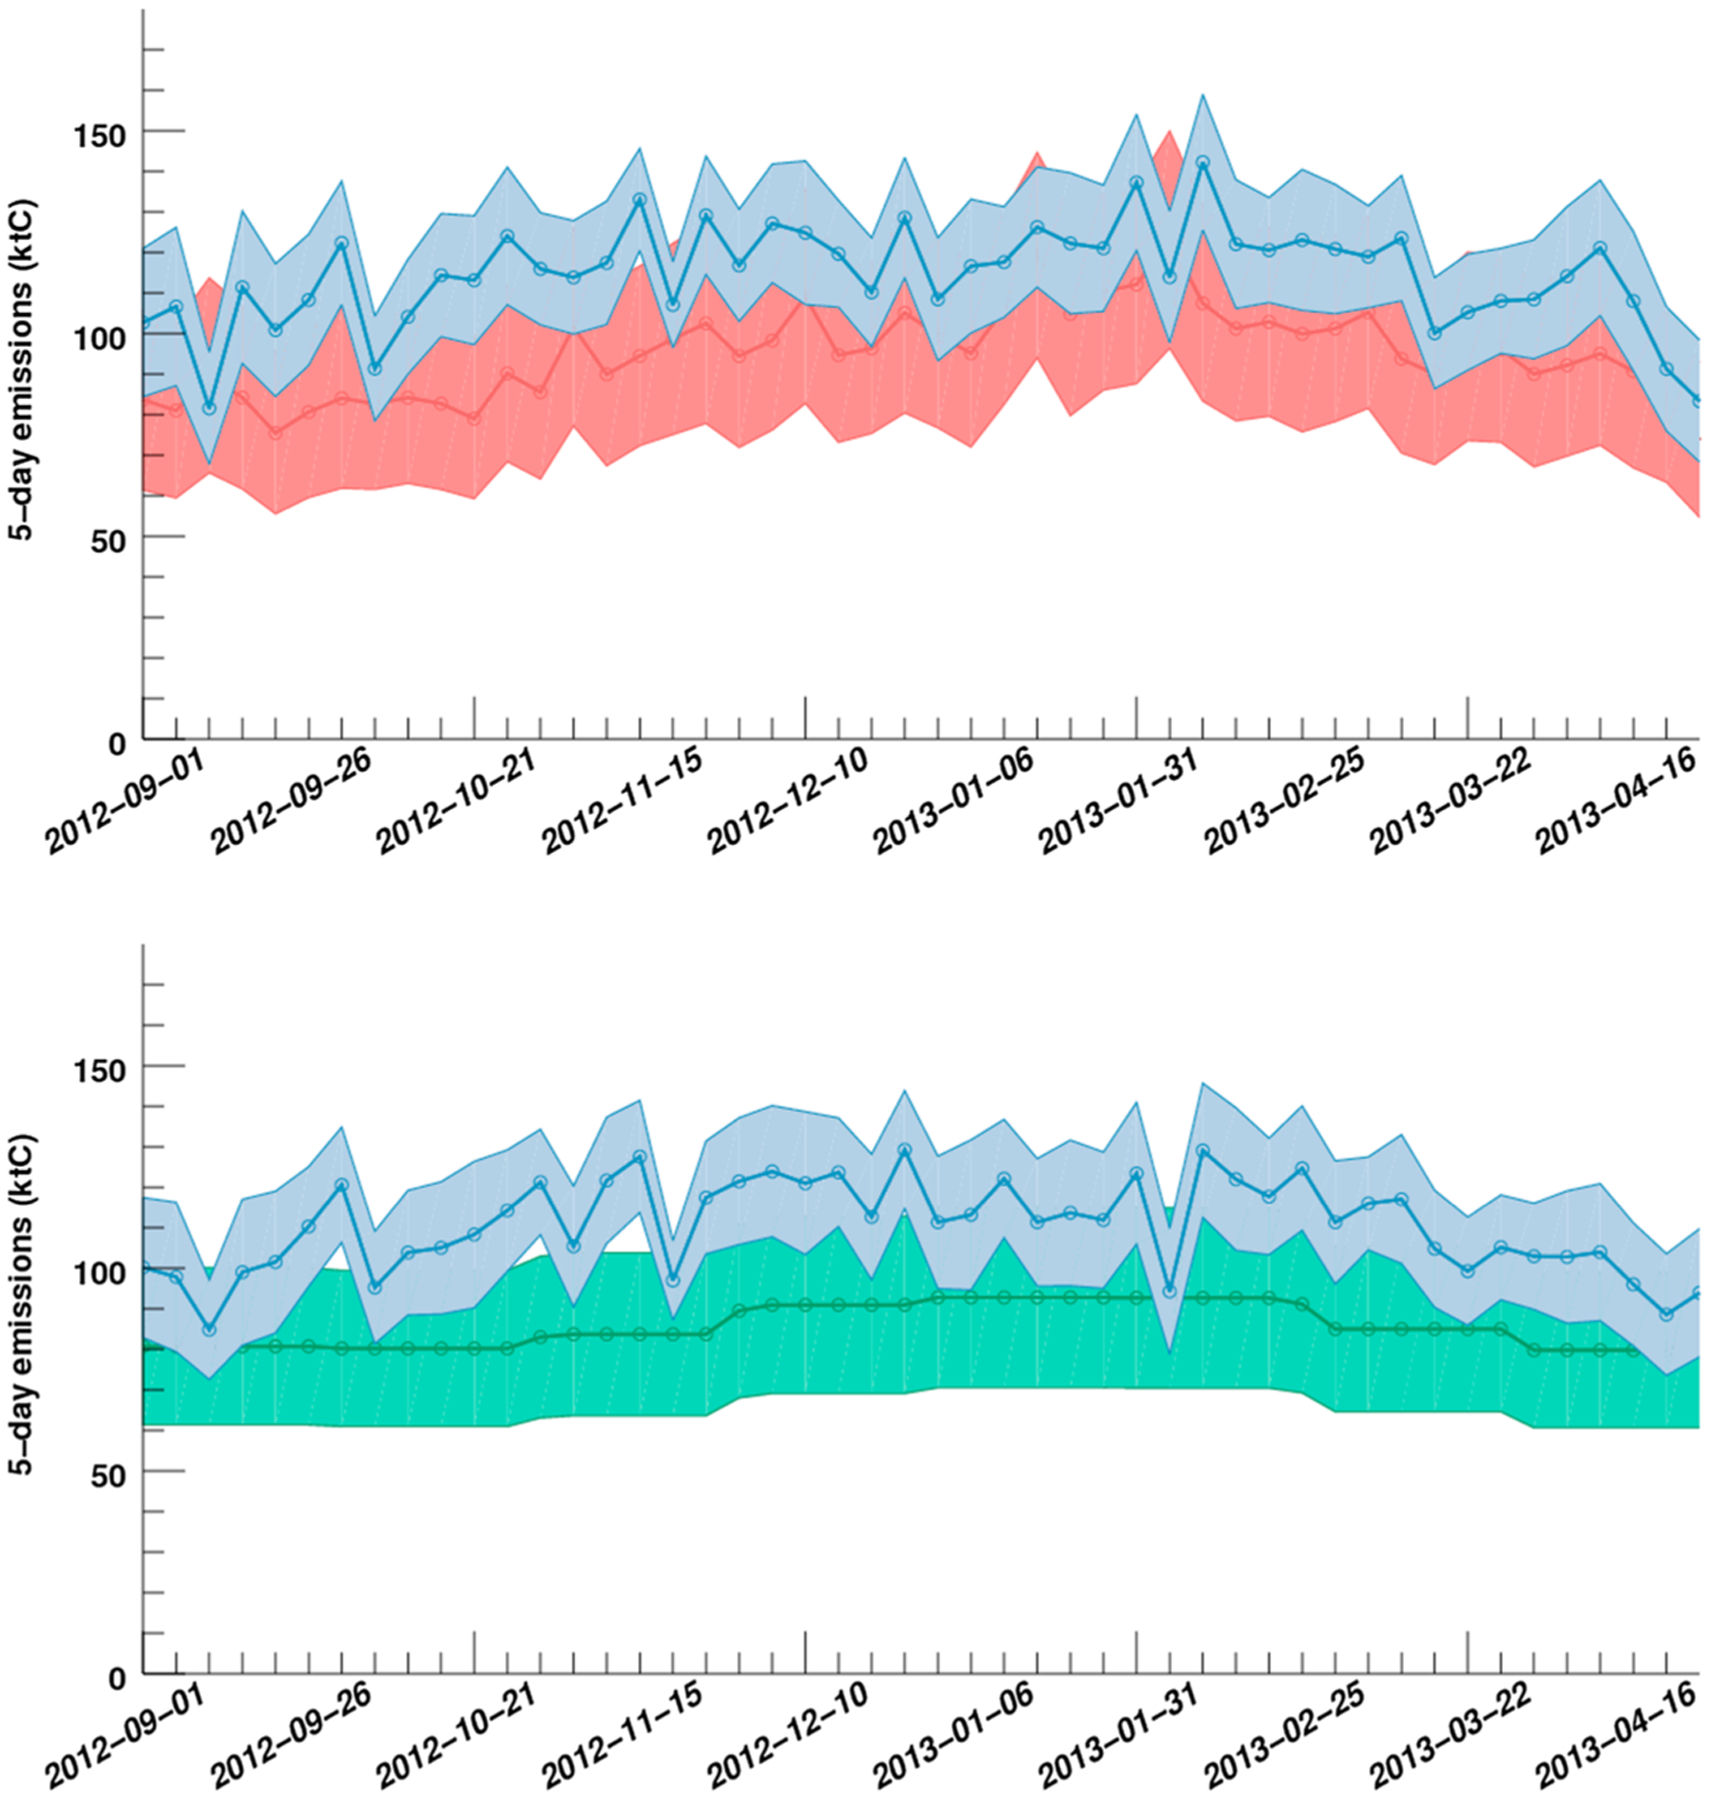
The 5 day inverse emission estimates in ktC for (top) Hestia (in red), (bottom) ODIAC (in green), and their respective inverse emissions (in blue) for the period September 2012–April 2013.
Official websites use .gov
A
.gov website belongs to an official
government organization in the United States.
Secure .gov websites use HTTPS
A lock (
) or https:// means you've safely
connected to the .gov website. Share sensitive
information only on official, secure websites.
The 5 day inverse emission estimates in ktC for (top) Hestia (in red), (bottom) ODIAC (in green), and their respective inverse emissions (in blue) for the period September 2012–April 2013.