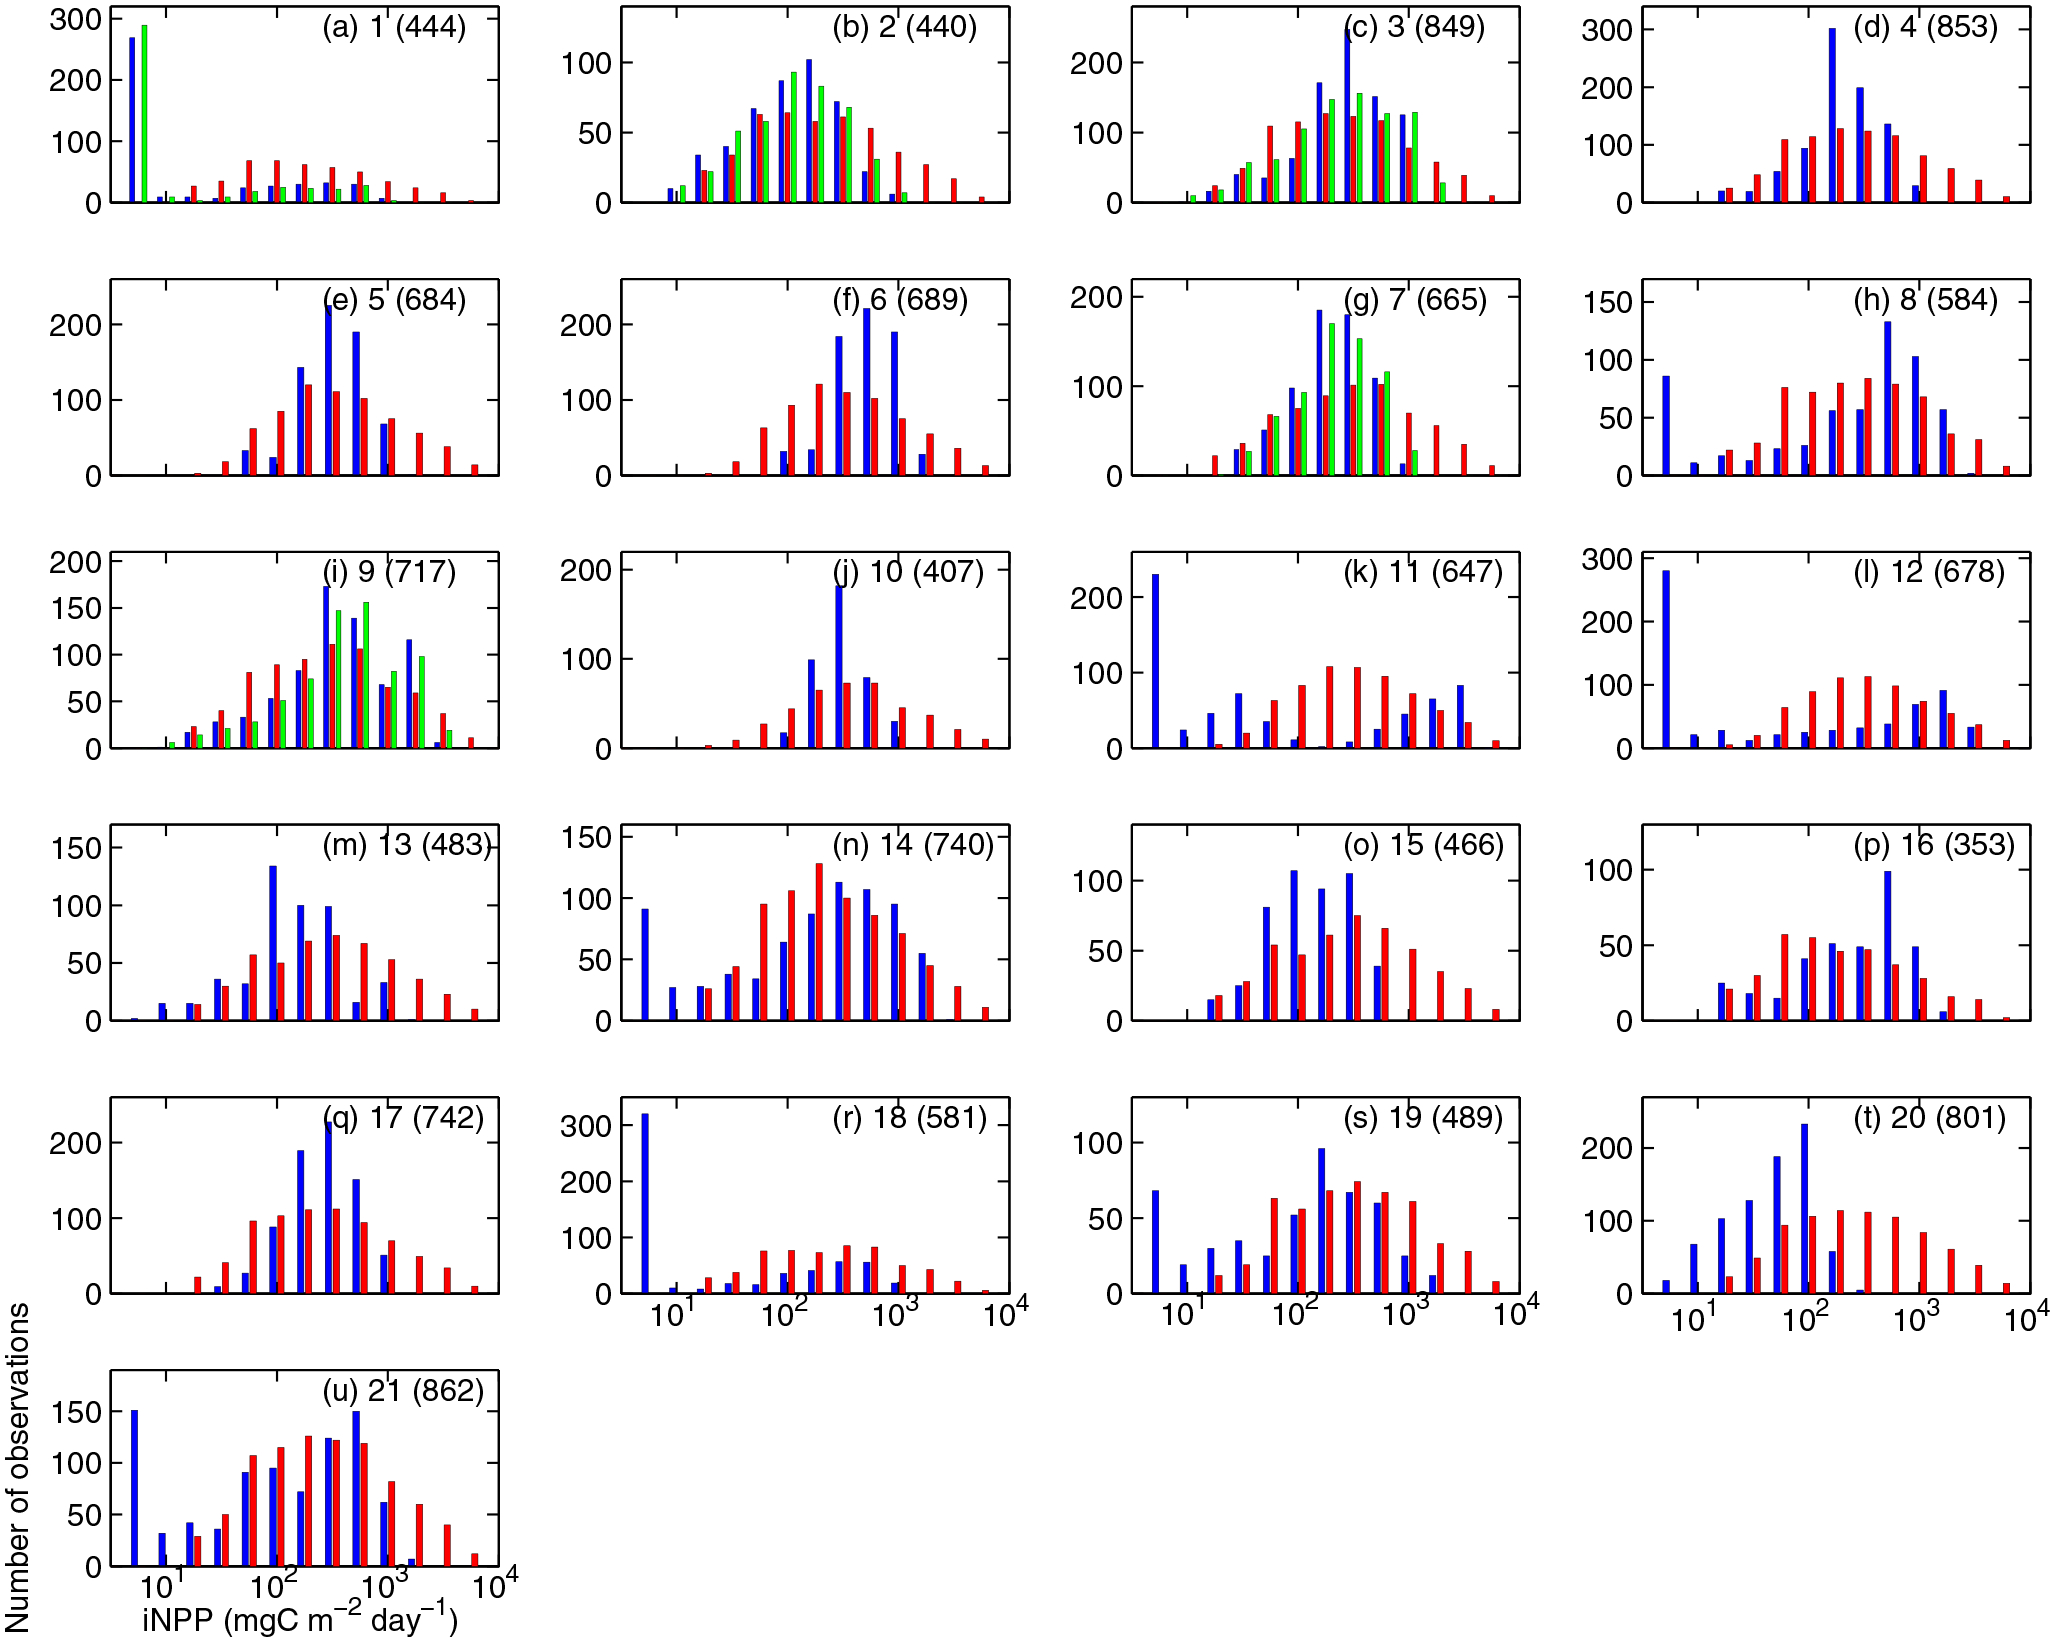
Figure 3.

(a–u) Histogram of simulated (blue, monthly mean; green, daily mean) and in situ iNPP (red; mgC m−2 d−1). Indicated are model numbers in the upper right with the number of sampling stations in parenthesis, which varies due to different simulation periods.
