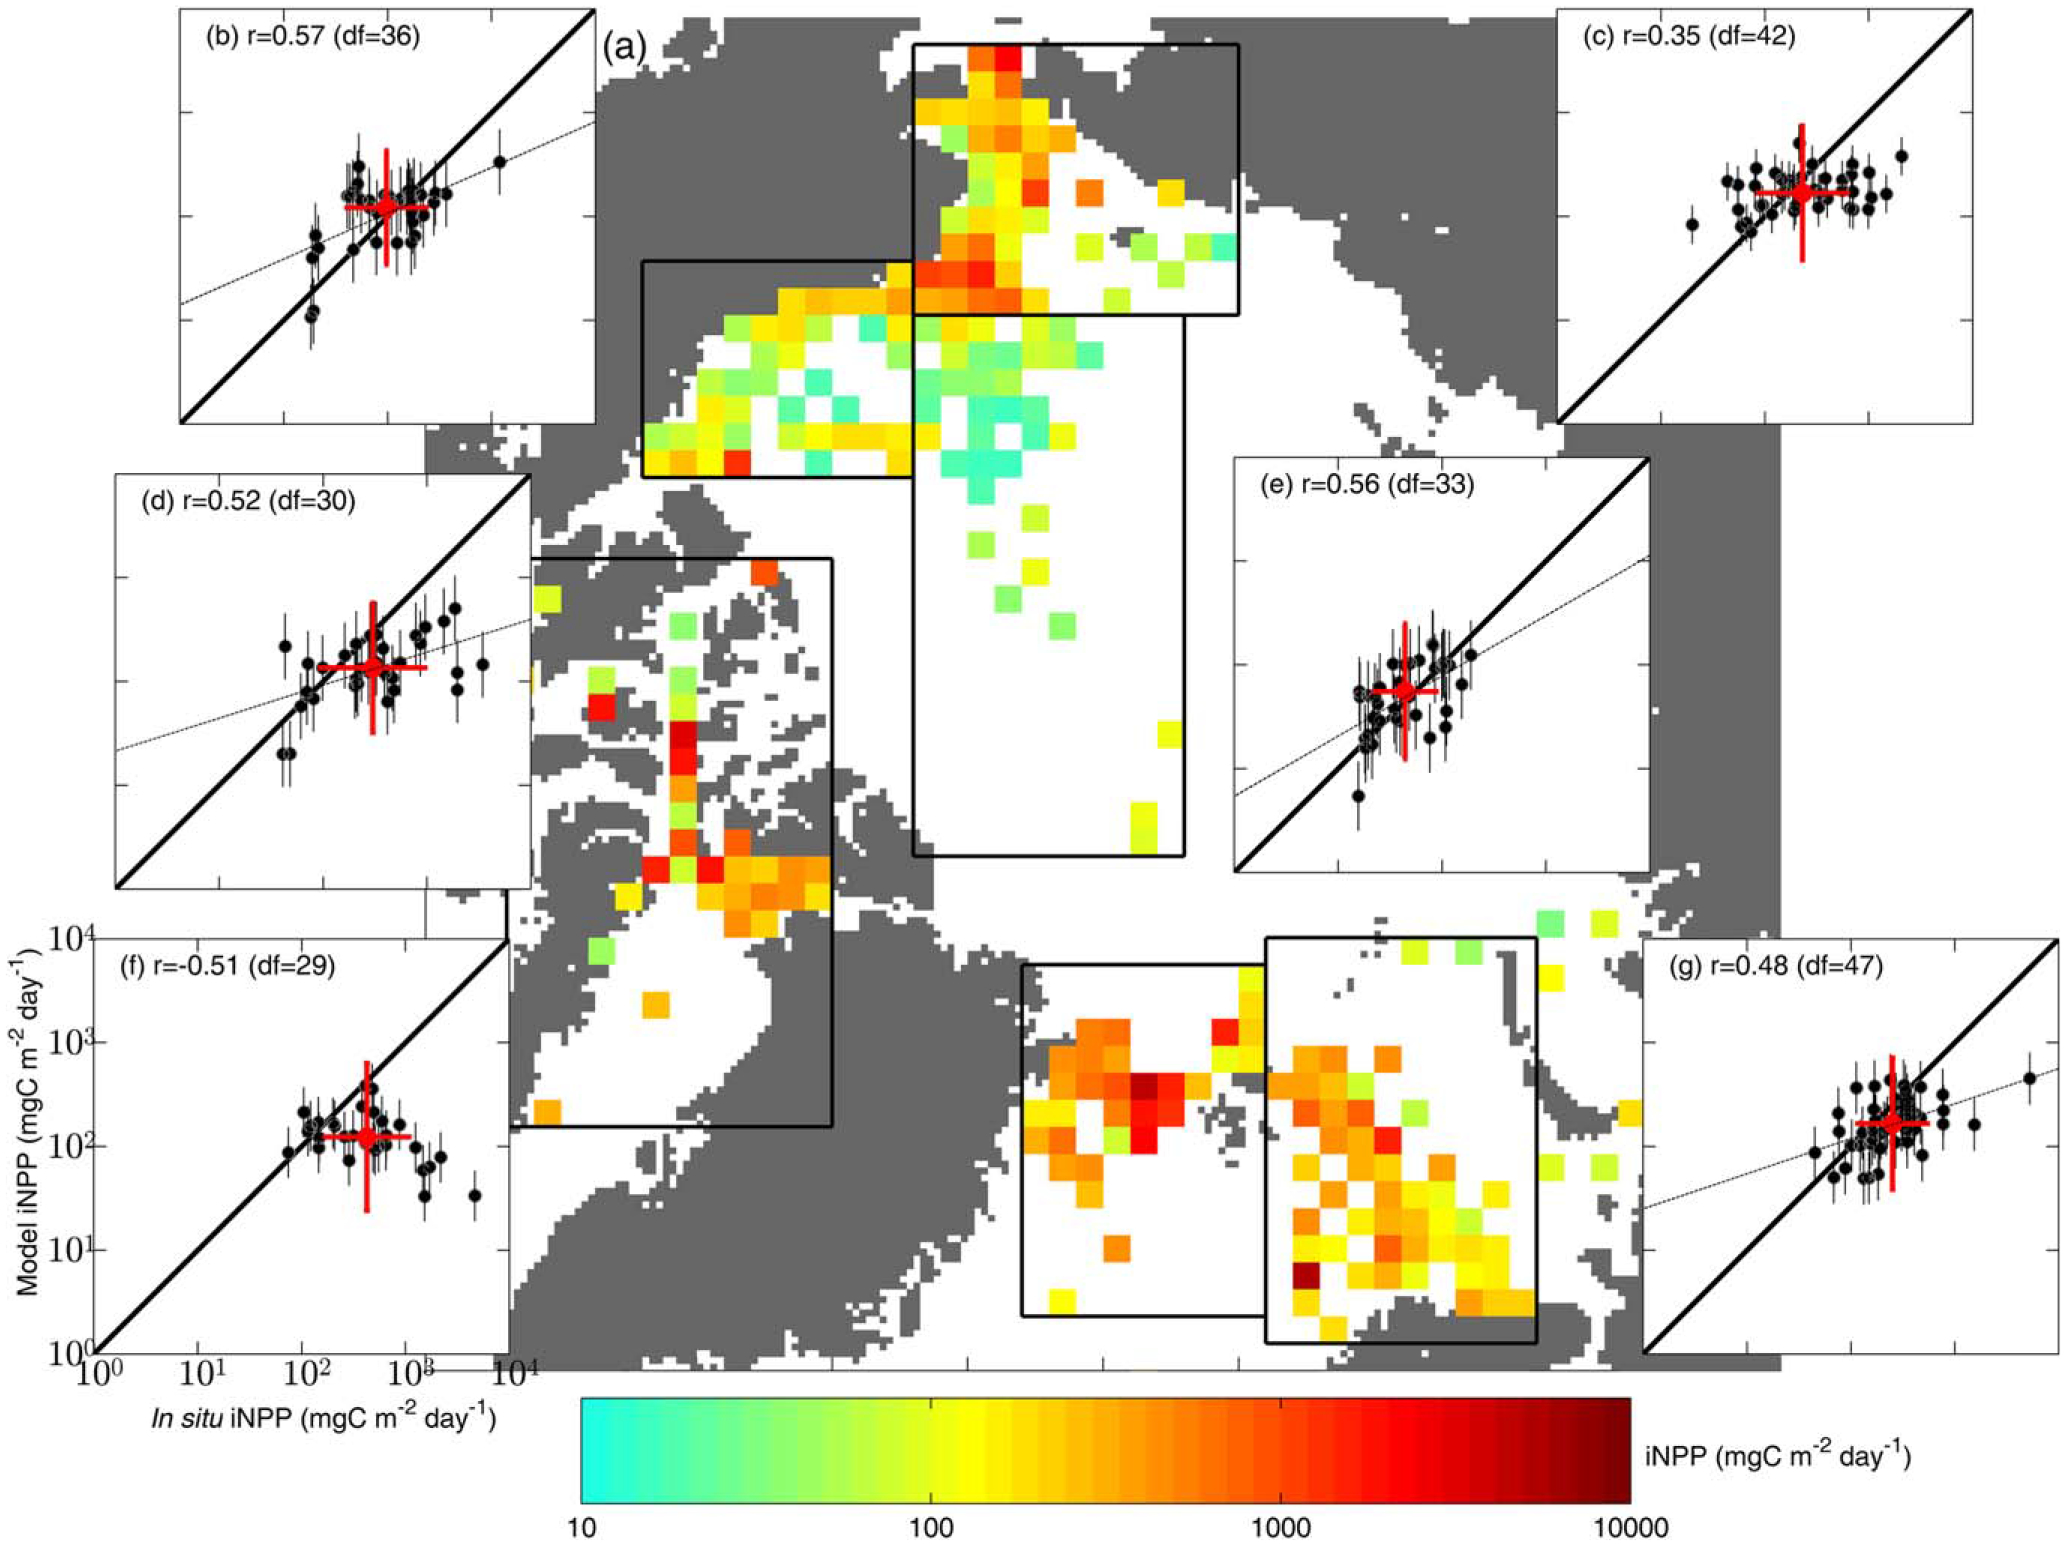
Figure 6.

(a) In situ iNPP (mgC m−2 d−1) projected on the EASE-Grid map is shown. (b–g) Average model estimates with an error bar (±1 standard deviation from the multimodel mean) in each grid cell were regionally compared to in situ values in Figure 6b the Beaufort Sea, 6c the Chukchi Sea, 6d Canadian Archipelago, 6e the central Arctic Basin, 6f the Greenland Sea, and 6g the Barents Sea; all inserts have the same axis units as in Figure 6f. In each plot, the solid-line shows a slope of 1.0 and the dashed line is a linear regression fit if significant (p<0.05). The correlation coefficient (r) with degrees of freedom (df = number of grid cells–2) are shown in the upper left. A red circle with error bars indicates the regional average of in situ (x axis) and modeled (y axis) iNPP.
