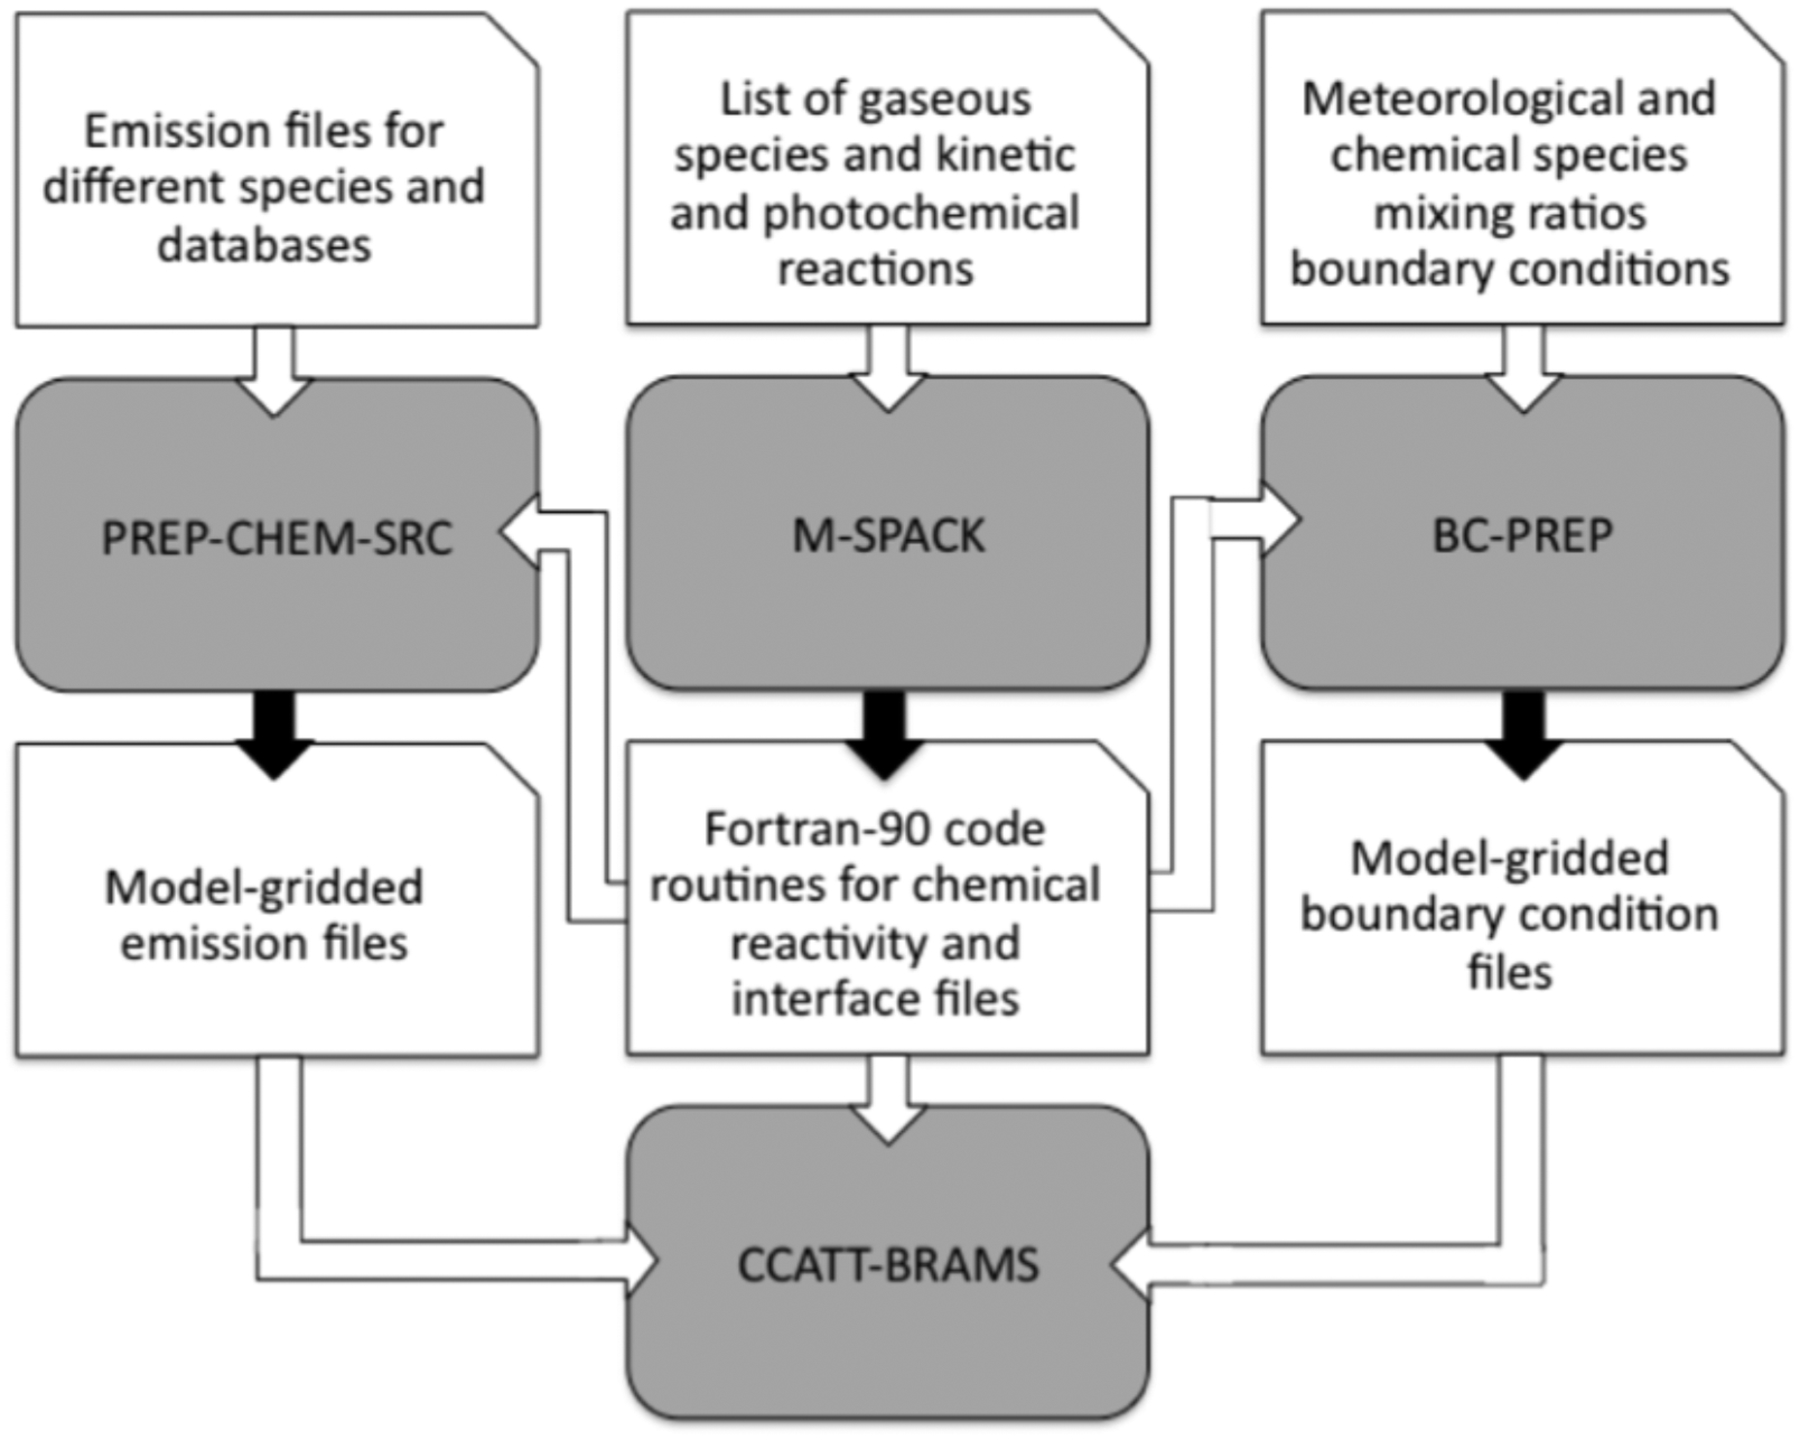
Figure 10.

A chart of the BRAMS system with the CCATT chemistry model component. The gray blocks and the black arrows indicate the codes that make up the CCATT-BRAMS System and their outputs, respectively. The white blocks indicate either the input files for the pre-processing (first line) as the pre- processing outputs (third line), which are also input files for pre-processing emissions and boundary conditions and routines for composing the BRAMS model (adapted from Longo et al., 2013).
