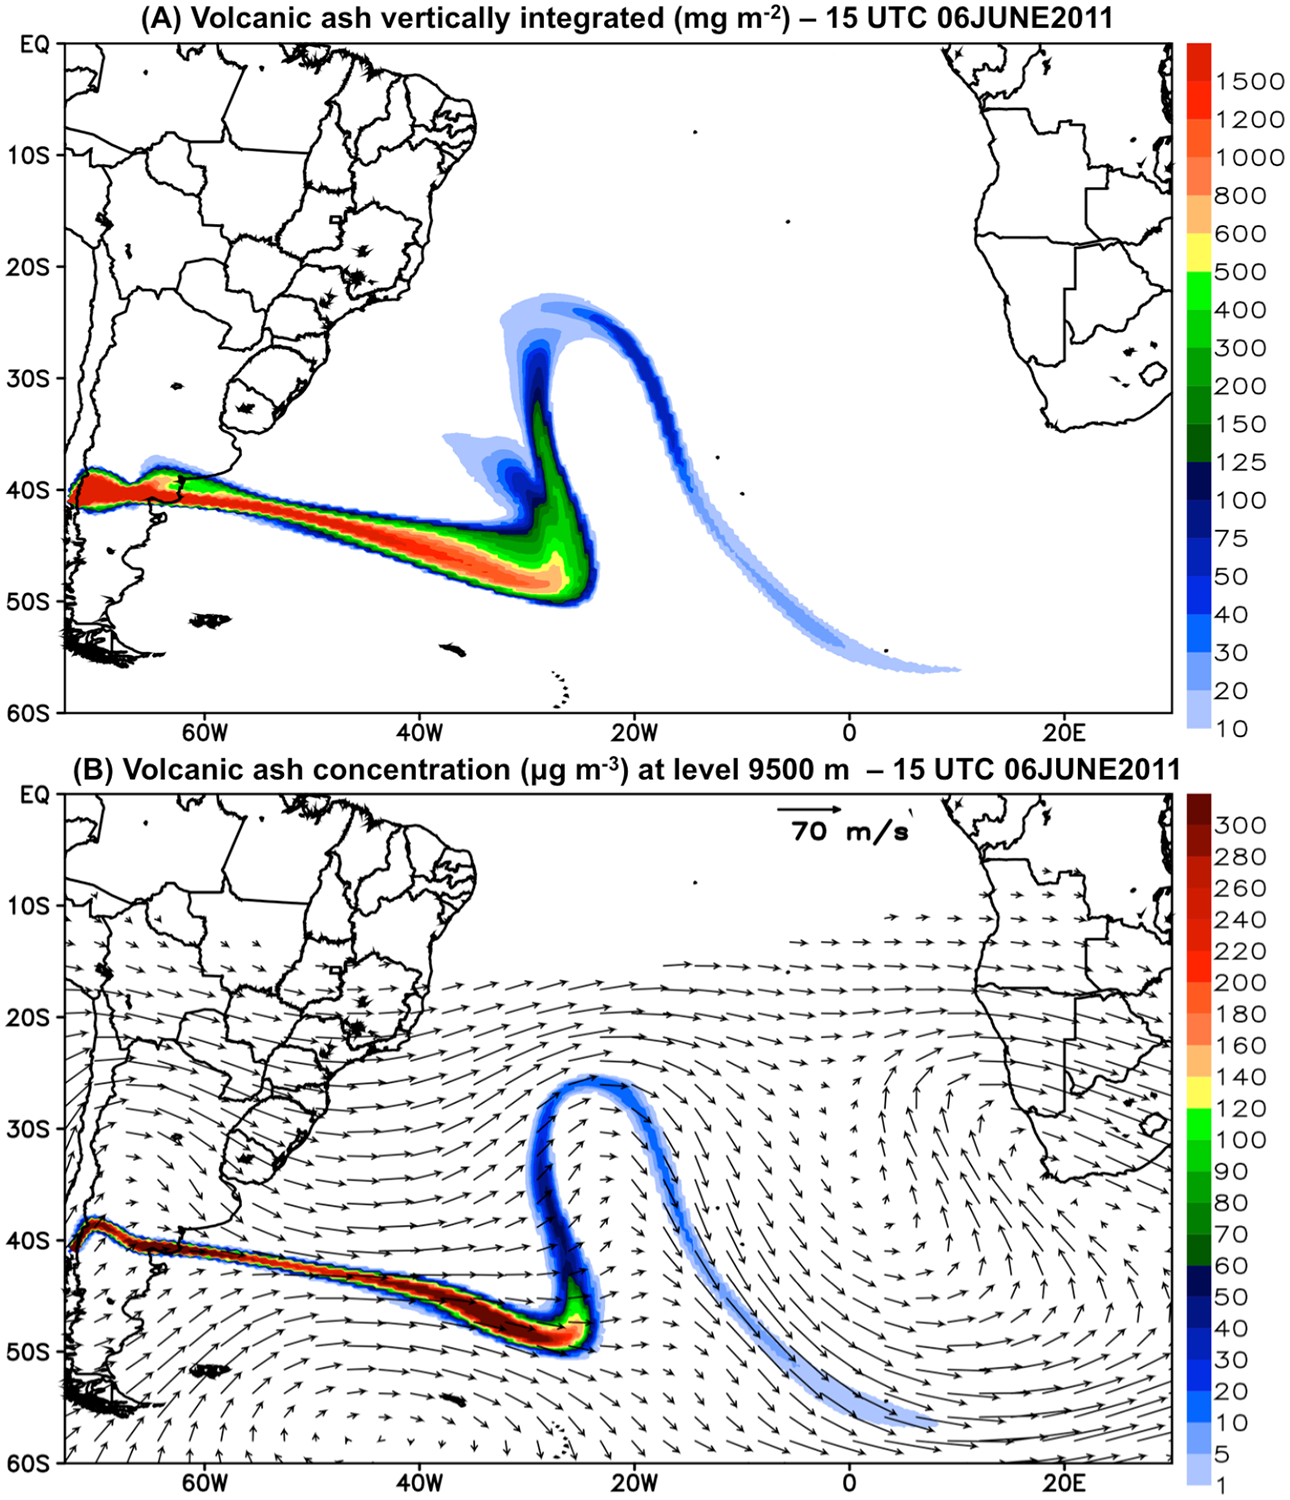
Figure 17.

(A) Vertically integrated total mass of ash (mg m−2). (B) Total ash mass concentration (μg m−3) at level of approximately 9500 m above surface and the associated horizontal wind. Both panels show results for 15UTC 06 June 2011 as simulated by BRAMS model.
