
Figure 22.
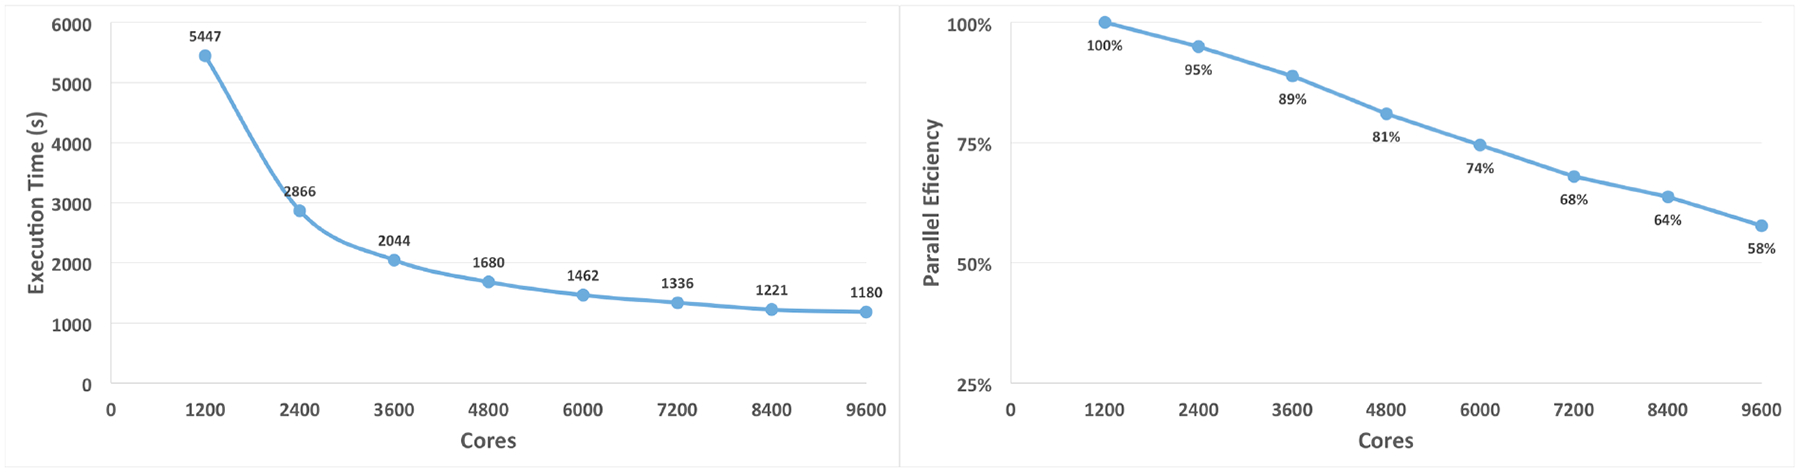
On the left, execution time of BRAMS on 5km grid spacing covering South America and adjacent Oceans in function of the number of computing cores. On the right appears the corresponding parallel efficiency.
Official websites use .gov
A
.gov website belongs to an official
government organization in the United States.
Secure .gov websites use HTTPS
A lock (
) or https:// means you've safely
connected to the .gov website. Share sensitive
information only on official, secure websites.
On the left, execution time of BRAMS on 5km grid spacing covering South America and adjacent Oceans in function of the number of computing cores. On the right appears the corresponding parallel efficiency.