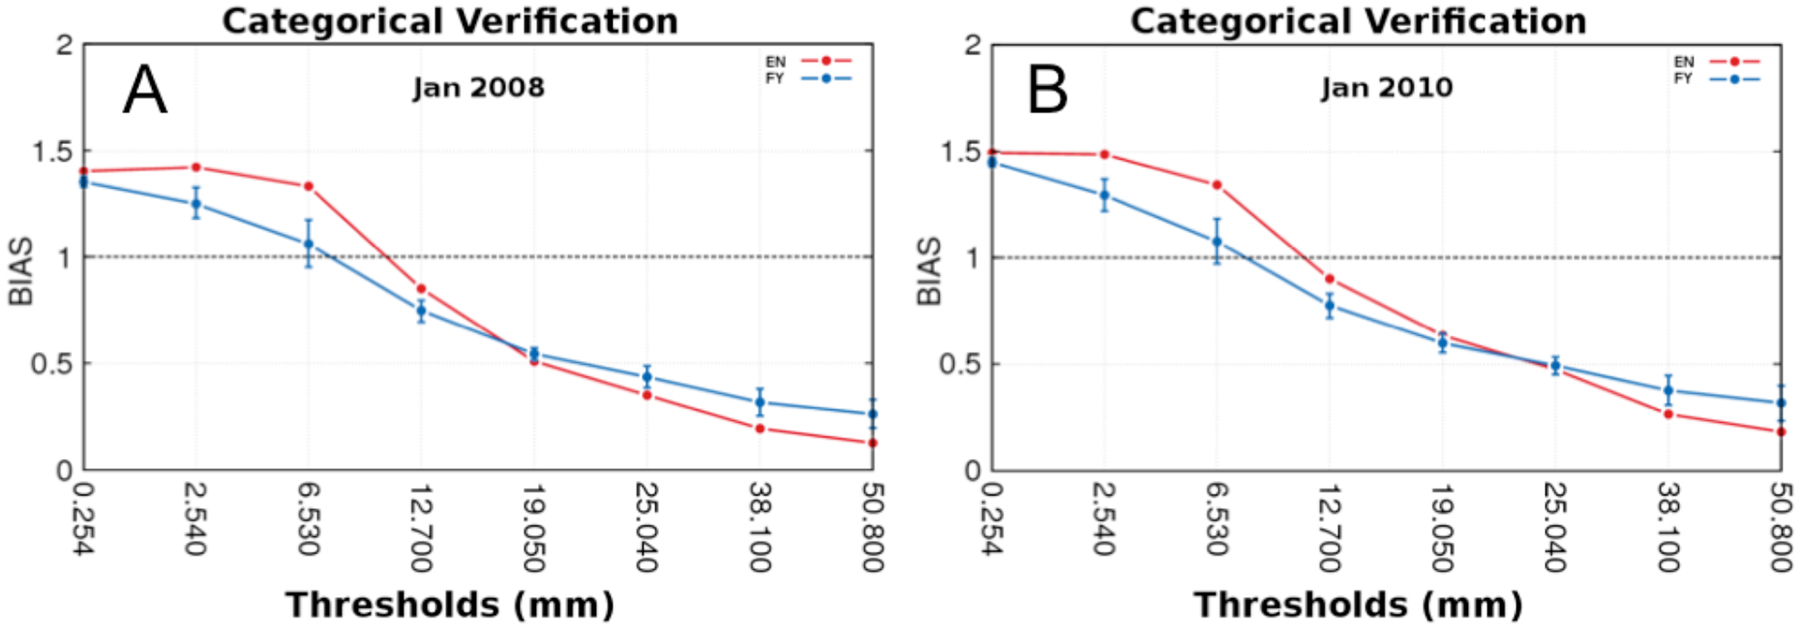
Figure 5.

Mean bias score versus precipitation thresholds for South America for a set of 30 forecasts of 24-h accumulated precipitation for 120h in advance for (A) January 2008 and (B) January 2010. Blue line represents simulations using FY weight method and red line the original EN. Blue bars indicate significance test from the bootstrap method (Hamill, 1999).
