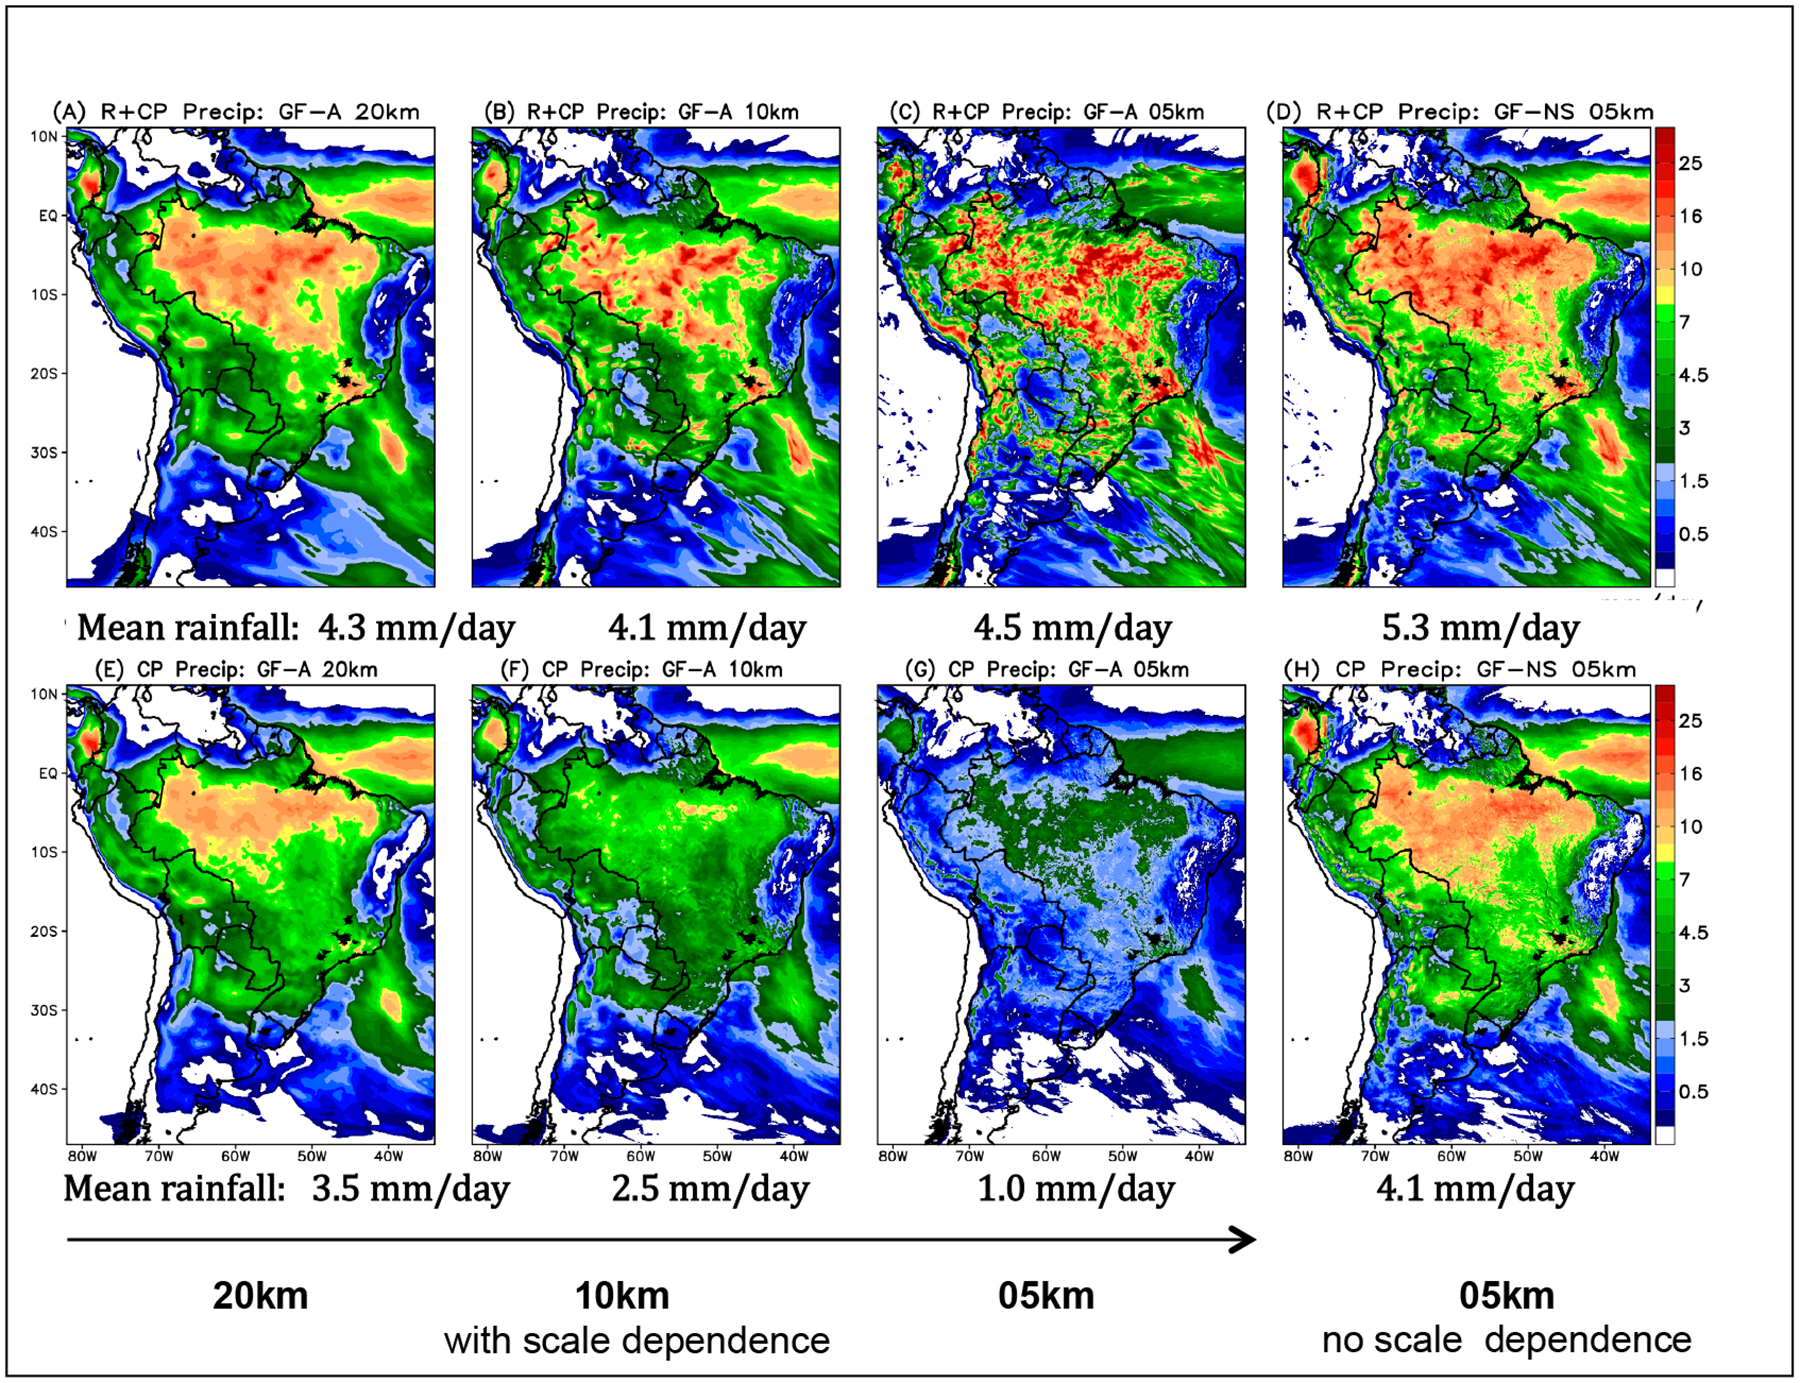
Figure 6.

Averaged precipitation rates over 15 runs for total precipitation (A, B, and C) and convective (nonresolved) precipitation (E, F and G), using the scale dependence formulation (GF-A) and horizontal resolutions of 20km (A, E), 10km (B, F) and 5km (C, G). The column on the right (panels D and H) depicts results on 5 km without the scale dependence formulation (GF-NS). Units are mm/day.
