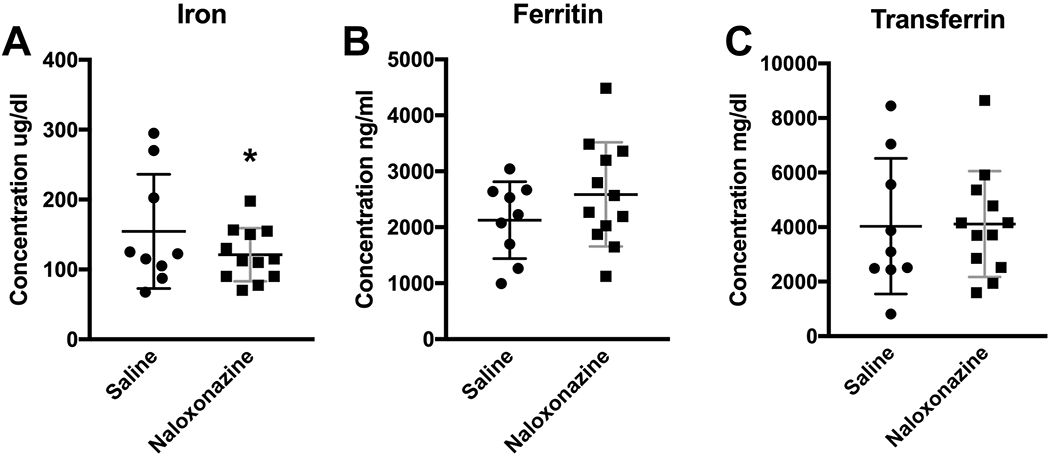
Figure 3.

Iron concentrations in serum of mice injected with naloxonazine (n=12) or saline (n=9). (A) The iron level decreased with naloxonazine injection. (B, C) Ferritin and transferrin levels did not have significant changes after the drug injection. Data in Figure 3A were analyzed by the GENMOD with a gamma distribution. Data in B and C were analyzed by the mixed model ANOVA. Scatter plots represent the means plus the SDs. * p≤0.05. Only males were used in the experiment.
