Figure 1.

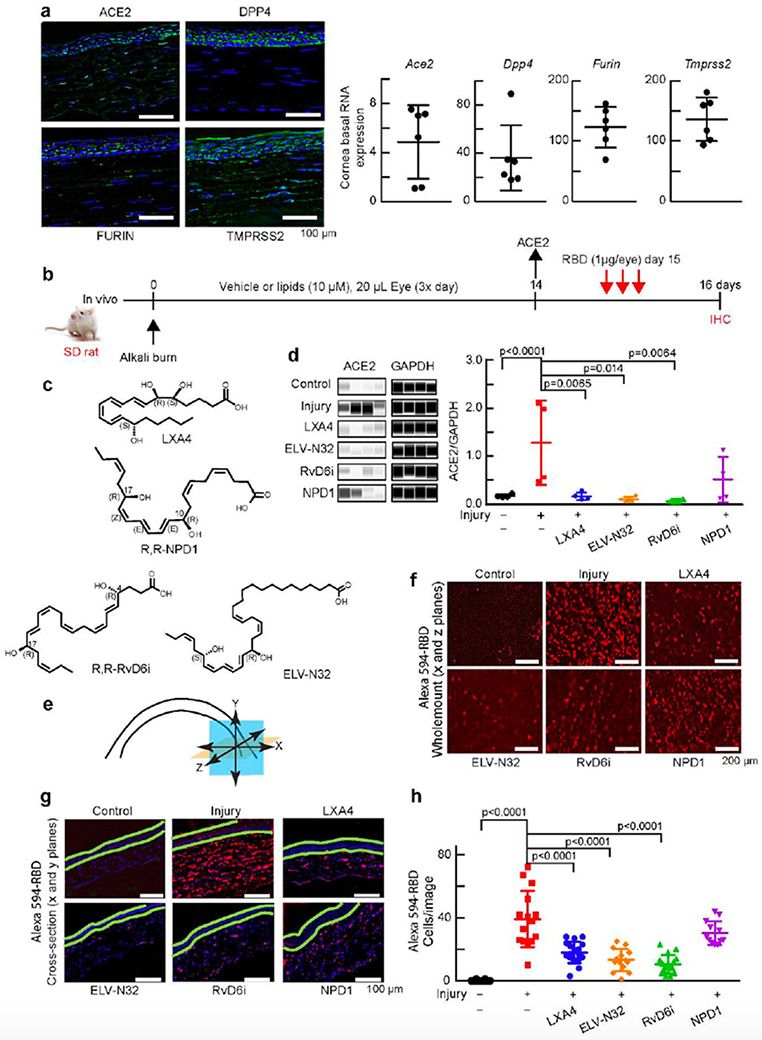
Selective lipid mediators reduce cornea injury-induced expression of ACE2 and binding of Alexa 594-RBD. a, Expression of Ace2, Dpp4, furin and Tmprss2 in the uninjured rat cornea. Left: representative immunofluorescence imaging. DAPI stains nuclei (blue). Immunofluorescence shows ACE2 expressed in the epithelium and stroma. Right: RNA-seq data. b, Experimental design. After alkali burn, rats received eye drops of lipid mediators or vehicle 20 μl/eye, 3 times/day for 14 days (double- blinded). ACE2 expression was assayed at day 14 after injury +/− lipids treatment. At day 15, rats were treated with Alexa 594-RBD (1 μg/eye, 3 times) and corneas examined a day later. c, Lipid mediators studied. The chirality in all figures of RvD6i and NPD1 used in this study had the R,R stereochemistry. d, ACE2 abundance before and after injury +/− lipids using Jess capillary-based Western Blot system (Protein Simple). ACE2 densitometry normalized to GAPDH in the same capillary to minimize errors. Data is from one rat cornea for each data point (N = 4). The p-values of ANOVA-post hoc Dunnett's multiple comparisons test with vehicle as reference are shown. Mean and SD are depicted as the lines. e, Illustration showing corneal analysis by wholemount (x and z planes – orange color) and cross-section (x and y planes – blue color). f, Wholemount images of binding of Alexa 594-RBD in corneas after injury and treatments. The control cornea (no-injury) has very low Alexa 594-RBD signal, while the injured cornea shows intense fluorescence. LXA4, ELV-N32, and RvD6i decrease Alexa 594-RBD binding while NPD1 fails. g, Cross-section images of the same corneas shown in f. The green lines were added to separate the epithelium from the stroma. Most of Alexa 594-RBD signal was found in the stroma. h, Quantification of Alexa 594-RBD positive cells. Each data point represents number of cells/cross-section image. Values are means ±SD and p-values calculated by ANOVA-post hoc Dunnett's multiple comparisons test with vehicle as reference (4 images/cornea and 4 rat corneas/condition). The map of image capture is shown in Supplementary Fig. S1.
