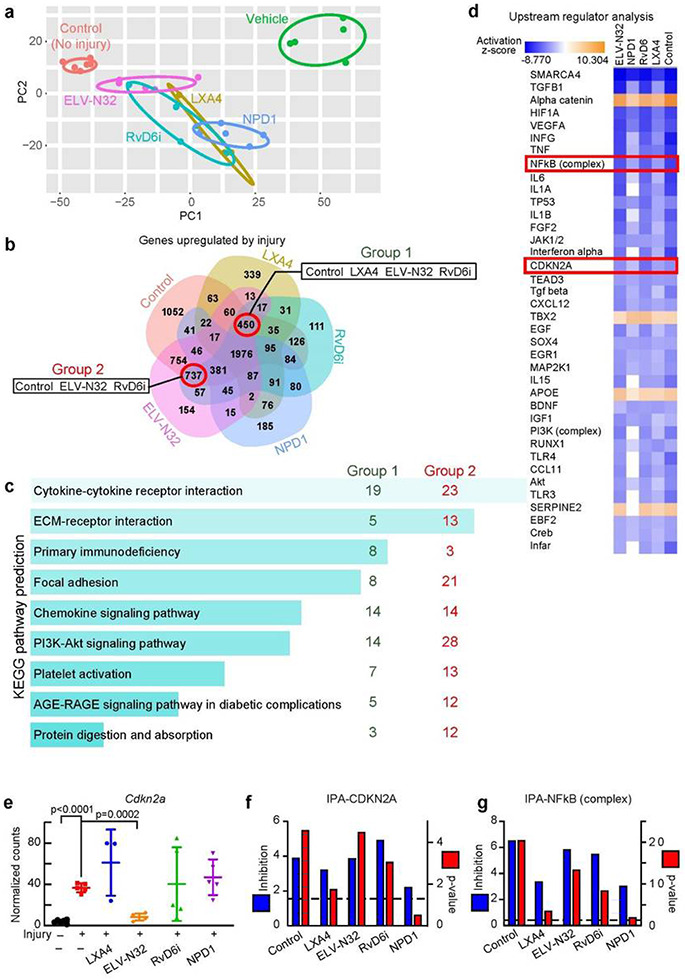
Figure 2.

Selective lipid mediators disrupt ACE2 upregulation and injury-mediated hyper- inflammation, senescence, and cytokine storm components. a, PCA plot of RNA-seq data. Rat corneas were analyzed at day 14 after injury +/− treatments (Fig. 1b). Each data point represents one animal (N = 5/group, except LXA4 with N = 3 and control with N = 6). The eclipse of 95% confidence interval was used to group data points from the same set of treatment. b, Venn diagram of significant genes (FDR < 0.05) upregulated by the vehicle treatment of injured corneas (RNA-seq data set was analyzed using DEseq2 with vehicle injured corneas as reference). The negative log2 fold change genes (upregulated by vehicle) with FDR < 0.05 were used. We excluded NPD1 because it failed to decrease Ace2 expression upon injury (Fig. 1d). The groups of shared genes between control-LXA4-ELV-N32-RvD6i and control- ELV-N32-RvD6i are depicted. c, The KEGG-pathway enrichment networks of selected genes from b. Bars were sorted by p-value. The length of the bar represents the significance of the pathway, while the lighter the color, the higher the significance. The number shows amount of genes from denoted group that are enriched in each pathway. d, IPA upstream regulator analysis of significant genes vs. vehicle (injury) group. There are proteins with negative activation z-score compared to vehicle group (blue color). Among those are CDKN2A and NFkB (complex). e, RNA-seq normalized counts of Cdkn2a gene that encodes the senescence key-marker p16INK4a; ELV-N32 decrease its expression. Data correspond to one cornea for each data point and is presented as mean ±SD. The p-values were analyzed by ANOVA-post hoc Dunnett's multiple comparisons test with vehicle as reference. The normalized counts were used for analysis. IPA scores for CDKN2A (f) and NFkB (complex) (g) upstream regulators. The left y-axis is the inhibition z-score, while the right y-axis e is −log10 of p-value. The cutoff line for p-value is <0.05.
