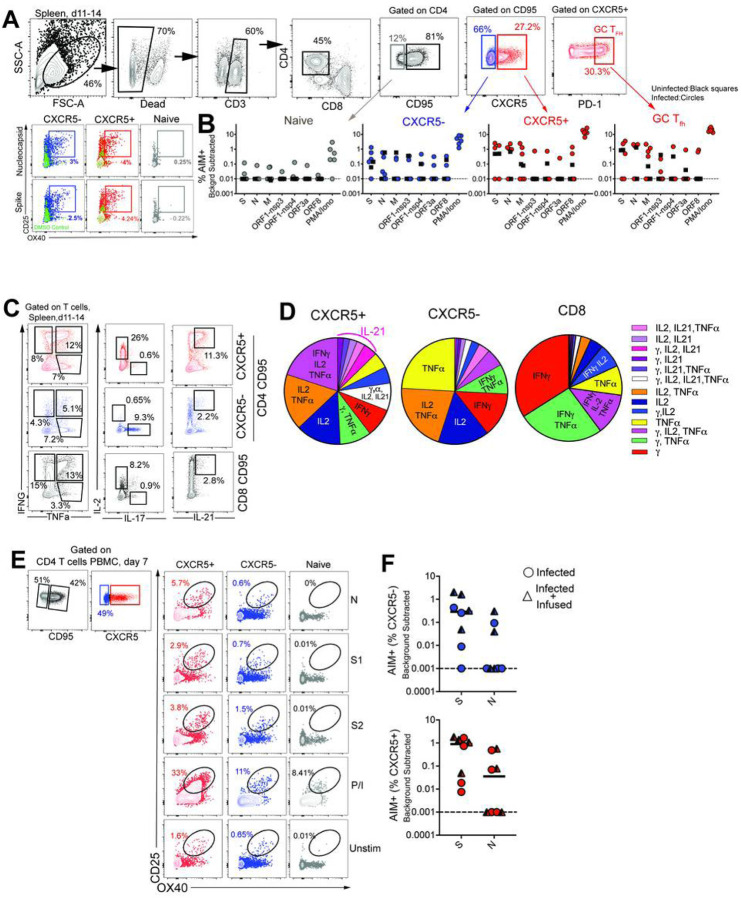
Figure 2.
CD4 Tfh cells targeting the spike (S) and nucleocapsid (N) are generated following SARS-CoV-2 infection (A) Gating to identify SARS-CoV-2 specific CD4 T cells following stimulation with peptide megapools (B) Scatter plot showing AIM+ CD4 subsets. Dashed line represents undetectable responses assigned a value of 0.01% (C) Cytokine profiles (IFNy, IL-2, TNFa, IL-17, IL-21) of CXCR5+, CXCR5-, and CD8+CD95+ T cells) in spleen following P/I stimulation. (D) Pie chart shows T cell polyfunctionality. (E) Gating to identify SARS-CoV-2 specific CD4 T cells in PBMCs. (F) AIM+ CXCR5- and CXCR5+ CD4 subsets in PBMCs at Day 7. Black squares denote SARS-CoV-2 unexposed animals.

