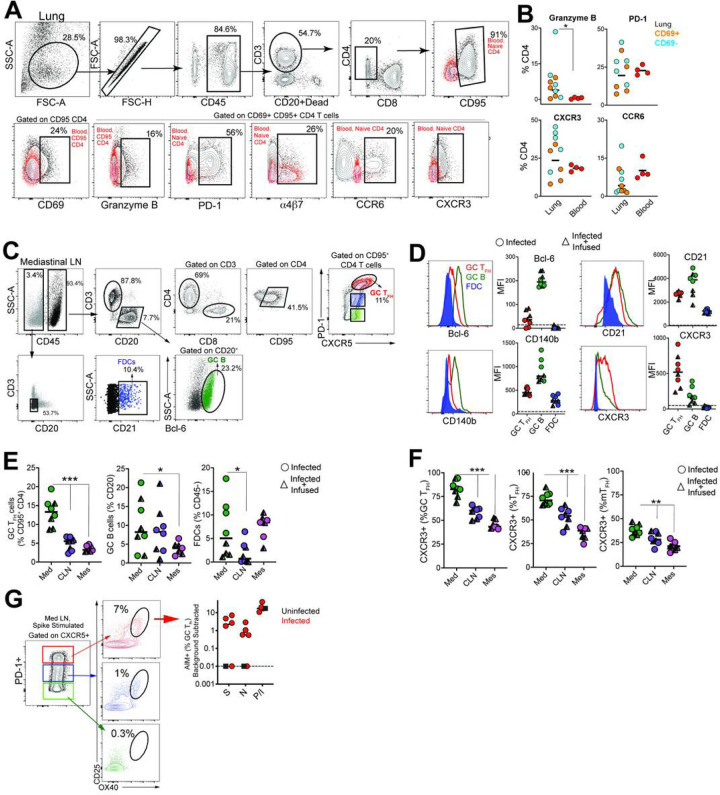
Figure 3.
SARS-CoV-2 infection induces germinal center responses in mediastinal lymph nodes. (A) Gating to identify CD4 T cells in lung (B) Dot plots show Granzyme B, PD-1, CXCR3, CCR6 expression on CD69- and CD69+ subsets in lung and CD95+ CD4 T cells in blood (n=5). (C) Gating for GC Tfh cells, GC B cells, and FDCs. (D) Expression of Bcl-6, CD21, CD140b, and CXCR3. (E) Frequency of GC Tfh cells, GC B cells, FDCs significantly higher in mediastinal lymph node (*p< 0.05, ***p< 0.001). (F) Majority of GC Tfh cells in mediastinal lymph nodes express CXCR3 (**p< 001; ***p< 0.001). (G) Flow plot of PD-1+ CXCR5+ (GC) Tfh cells shows AIM+ cells following stimulation with spike; scatter plot shows specificity of GC Tfh cells to SARS-CoV-2 spike and nucleocapsid. The dashed line represents undetectable responses assigned a value of 0.01 %. Black squares denote SARS-CoV-2 unexposed animals.

