
Figure 4.
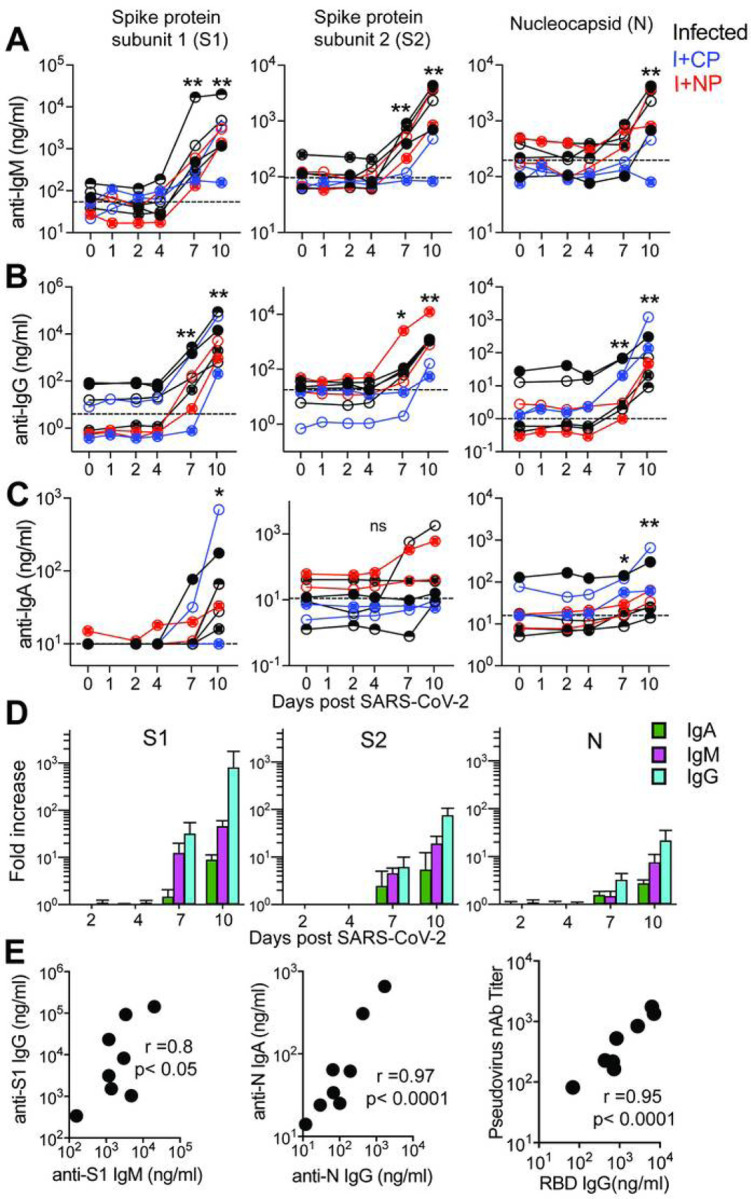
Humoral responses to SARS-CoV-2 are dominated by IgG antibodies Concentrations of (A) IgM, (B) IgG, and (C) IgA antibodies specific for S1, S2, and N proteins measured by BAMA or ELISA in serum. The dashed line represents the median pre-infection (day 0) concentration for all animals. (D) Fold increase in antibody responses in animals not given CP was determined by dividing post-infection concentrations by those measured on day 0 in each animal. Geometric mean fold increases with SEM are shown. (E) Correlations between day 10 levels of S1 -specific IgG and IgM, N-specific IgA and IgG, and pseudovirus neutralizing antibody titers and anti-RBD IgG antibodies measured by ELISA. Unique symbols identify animals in each of the experimental groups.