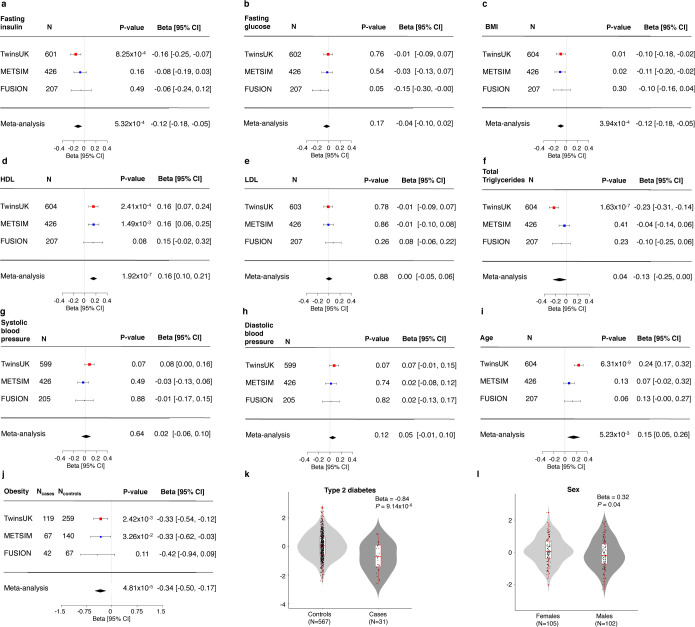
Figure 1: Associations of adipose tissue ACE2 expression levels with cardio-metabolic and demographic traits in the TwinsUK, METSIM and FUSION studies.
Squares with error bars represent the standardised β coefficients and their 95% confidence intervals for association of ACE2 expression levels with each of the traits (derived from linear/linear mixed effects regression models), with the meta-analysis effect sizes and 95% confidence intervals (random-effects meta-analysis) shown as black diamonds. N represents the sample size for each analysis. a) serum fasting insulin, b) fasting plasma glucose, c) BMI d) serum HDL cholesterol, e) serum LDL cholesterol, f) serum total triglycerides, g) systolic blood pressure, h) diastolic blood pressure, i) age, j) obesity status. Association of ACE2 expression with k) type 2 diabetes status in TwinsUK and l) sex in the FUSION study. Boxplots (k-l) display the median and inter-quartile range (IQR), with whiskers corresponding to +/− 1.5*IQR.

