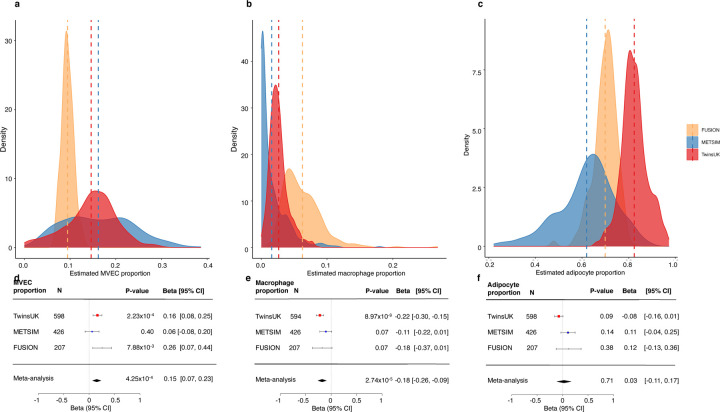
Figure 2: Adipose tissue estimated cell type proportions and their association with ACE2 expression levels across the TwinsUK, METSIM and FUSION studies.
Density plots of estimated cell type proportions of a) microvascular endothelial cells (MVEC), b) macrophages, c) adipocytes in each of the TwinsUK, METSIM and FUSION studies. Vertical dashed lines correspond to the study mean. d-f) Association of adipose tissue ACE2 expression levels with estimated d) MVEC, e) macrophage and f) adipocyte proportions. Squares with error bars represent the standardised β coefficients and their 95% confidence intervals for association of ACE2 expression levels with each of the traits (derived from linear/linear mixed effects regression models), with the meta-analysis effect sizes and 95% confidence intervals (random-effects meta-analysis) shown as black diamonds. N represents the sample size for each analysis.

