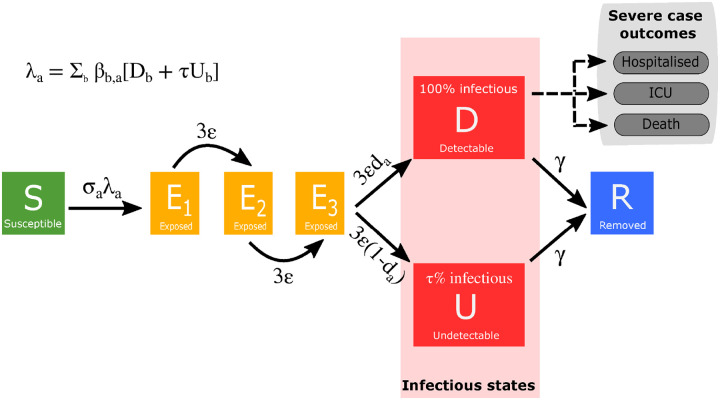
Fig. 1: Model schematic of infection states and transitions.
We stratified the population into susceptible, exposed, detectable infectious, undetectable infectious, and removed states. Solid lines correspond to disease state transitions, with dashed lines representing mapping from detectable cases to severe clinical cases that require hospital treatment, critical care (ICU), or result in death. We stratified the population into five year age brackets. See Tables 1 and 2 for a listing of model parameters. Note, we have not included quarantining or household infection status on this depiction of the system.

