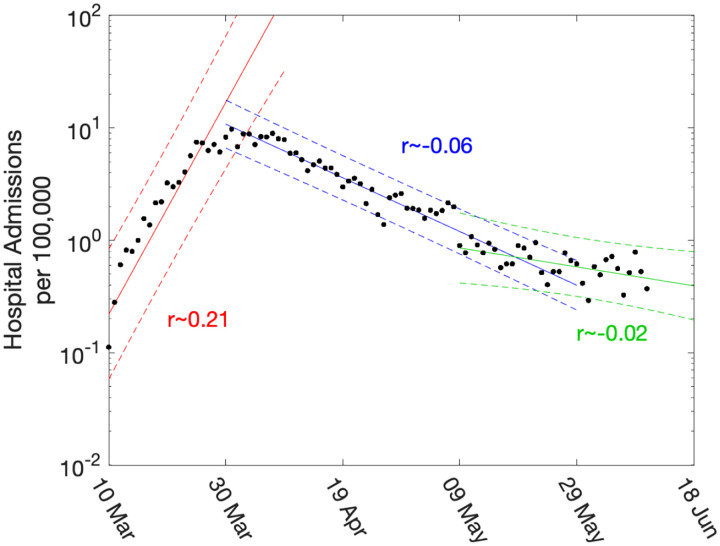
Fig. 2: Daily hospital admissions per 100,000 individuals in London.
Points show the number of daily admissions to hospital (both in-patients testing positive and patients entering hospital following a positive test); results are plotted on a log scale. We show three simple fits to the data are shown for pre-lockdown (red), strict-lockdown (blue) and relaxed-lockdown phases (green). Lines are linear fits to the logged data together with 95% confidence intervals, returning average growth rates of 0.21 (doubling every 3.4 days), −0.06 (halving every 11.5 days) and −0.02 (halving every 34 days).

