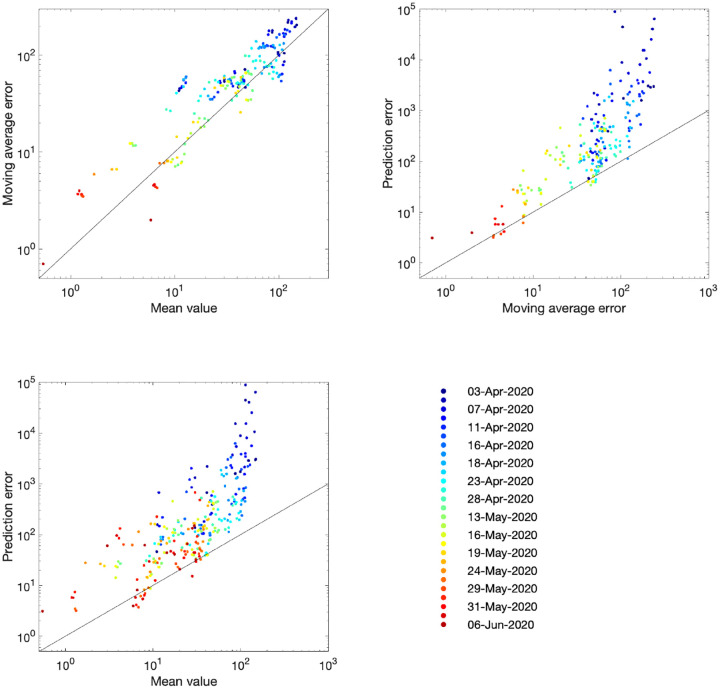
Fig. 4: Improvement in fit over time for the number of hospital deaths.
Each dot represents an analysis date (colour-coded) and region. For a data stream xt and model replicates (where i accounts for sampling across the posterior parameter values) we compute the mean ; the prediction error ; the moving average ; and the moving average error . In each panel, the solid line corresponds to the path where the presented error statistic is equal to the mean.

