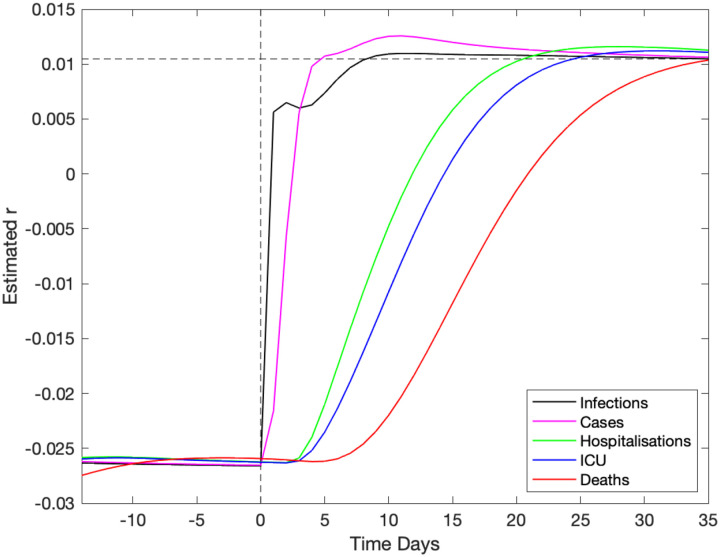
Fig. 5: Impact of a change in underlying restrictions on the growth rate of modelled data streams.
A change in the underlying restrictions occurs at time zero, taking the asymptotic growth rate r from ≈ −0.026 to ≈ +0.01. This change is reflected in an increase in growth rate of five key epidemiological quantities, which reach the true theoretical growth rate at different times.

